Dashmate#
Dashmate is a universal tool designed to help you set up and run Dash masternodes in a containerized environment. It is also an ideal tool to quickly and easily set up and run a development network on your local system.
Installation#
This guide describes how to download, install and use dashmate on for Linux. The guide is written for Ubuntu 22.04 x64 LTS, but the steps should be similar for other Linux distributions.
Install dependencies#
Install and configure Docker:
curl -fsSL https://get.docker.com -o get-docker.sh && sh ./get-docker.sh
sudo usermod -aG docker $USER
newgrp docker
Install dashmate#
There are several methods available for installing dashmate. Installing the Linux, MacOS, or Windows packages from the GitHub releases page is recommended for mainnet masternodes.
Debian package#
Download the newest dashmate installation package for your architecture from the GitHub releases page:
wget https://github.com/dashpay/platform/releases/download/v1.5.1/dashmate_1.5.1.8f924cc0a-1_amd64.deb
Install dashmate using apt:
sudo apt update
sudo apt install ./dashmate_1.5.1.8f924cc0a-1_amd64.deb
Note
At the end of the installation process, apt
may display an error due to installing a downloaded package. You can ignore this error message:
N: Download is performed unsandboxed as root as file '/home/ubuntu/dashmate_1.5.1.8f924cc0a-1_amd64.deb' couldn't be accessed by user '_apt'. - pkgAcquire::Run (13: Permission denied)
Node package#
Warning
This installation option is not recommended for mainnet masternodes. Please install packages from the GitHub releases page.
Node.js dashmate install
To install the NodeJS package, it is necessary to install NodeJS first. We recommend installing it using nvm:
curl -o- https://raw.githubusercontent.com/nvm-sh/nvm/v0.39.5/install.sh | bash
source ~/.bashrc
nvm install 20
Once NodeJS has been installed, use npm to install dashmate:
npm install -g dashmate
Masternode setup#
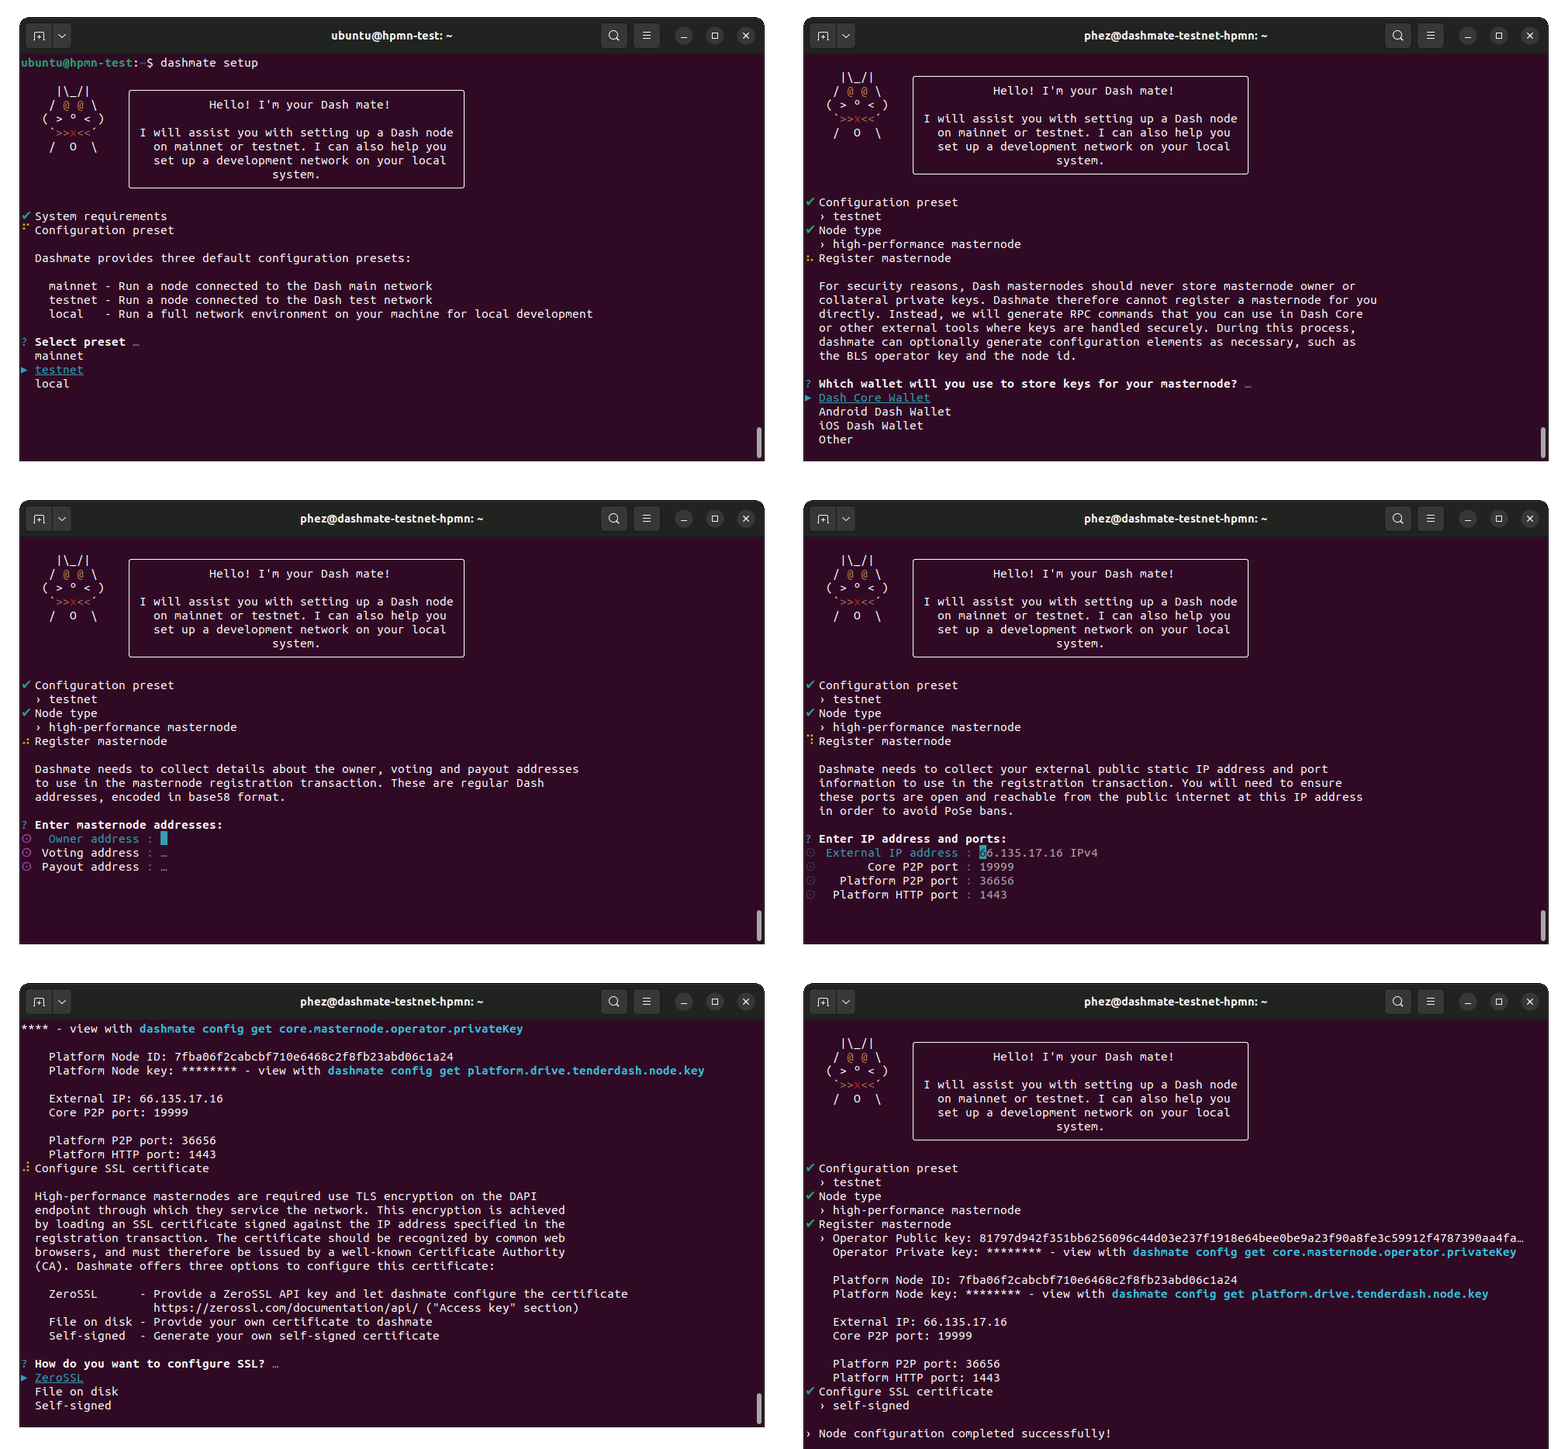
Dashmate is primarily recommended for setting up Evolution masternodes (evonodes). With the exception of a few minor extra steps for evonodes, the process is identical for evonodes and regular masternodes. Complete the steps in the sections below to set up your node or follow along with this step-by-step tutorial.
To begin masternode setup, run dashmate setup
to start the interactive wizard:
dashmate setup
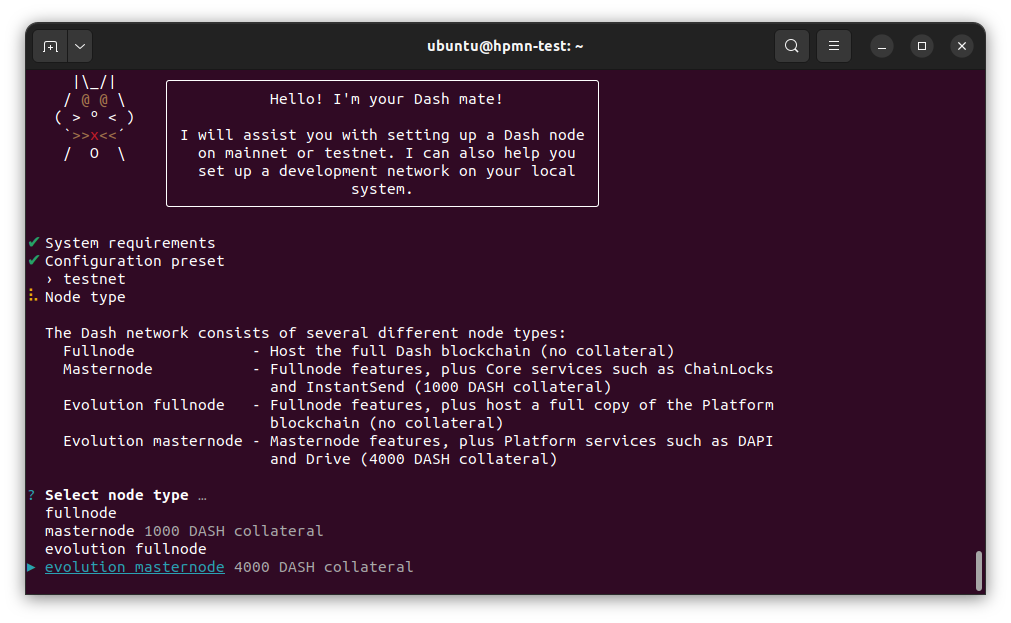
Set Network and Node type#
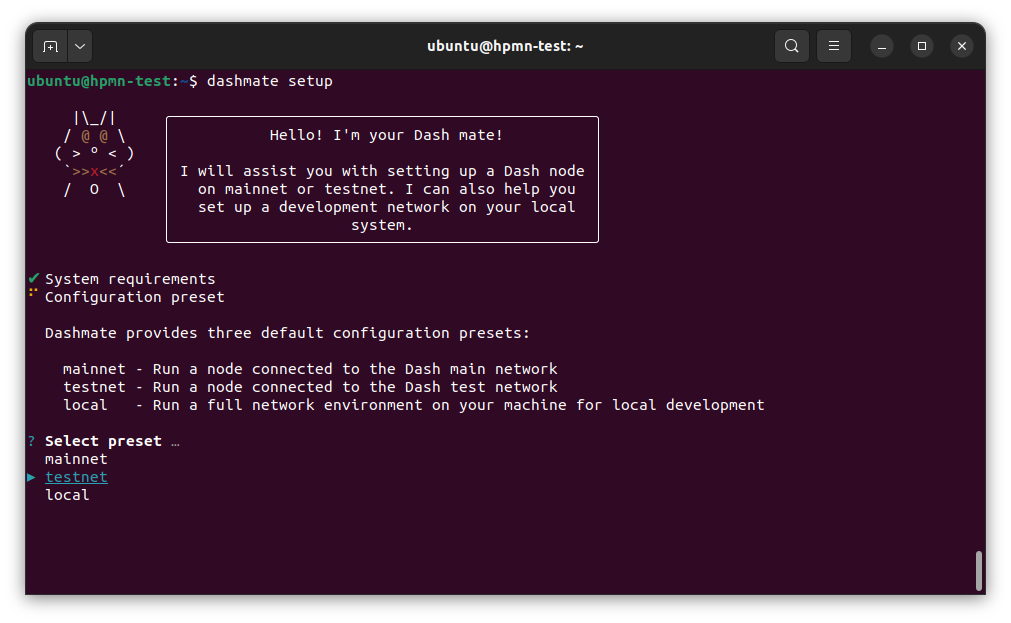
Select No to register a new masternode or Yes to import information about an existing masternode.
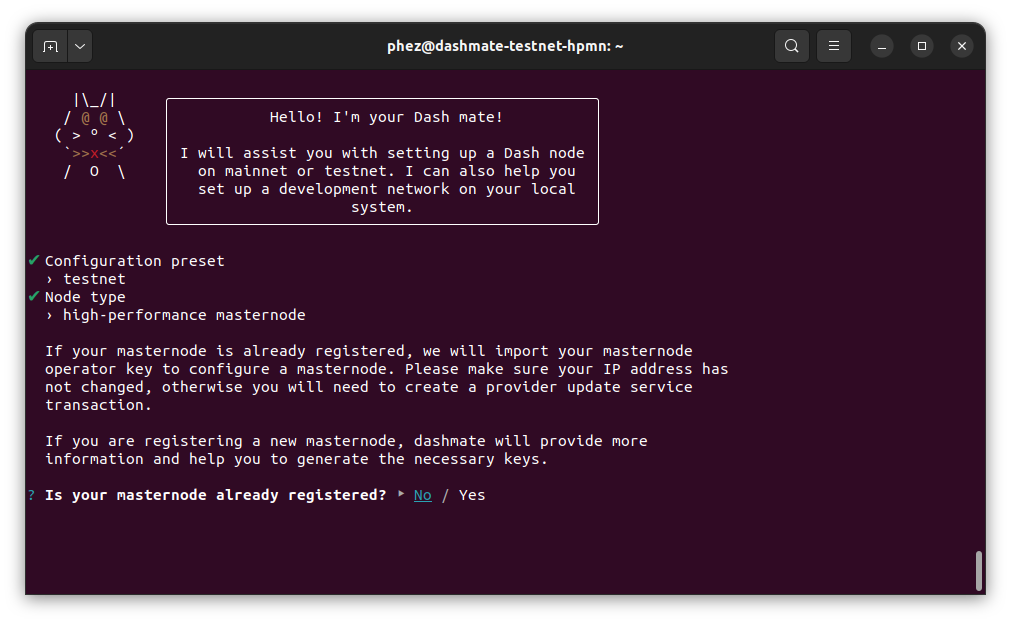
If registering a new masternode, jump to the defining keys and addresses section next.
Import existing Core data#
Note
The following step only applies when migrating an existing masternode into dashmate.
If you chose to import an existing masternode in the previous step, you will be prompted for the location of your existing installation.
Once the Core data has been imported, jump to the configure communication section.
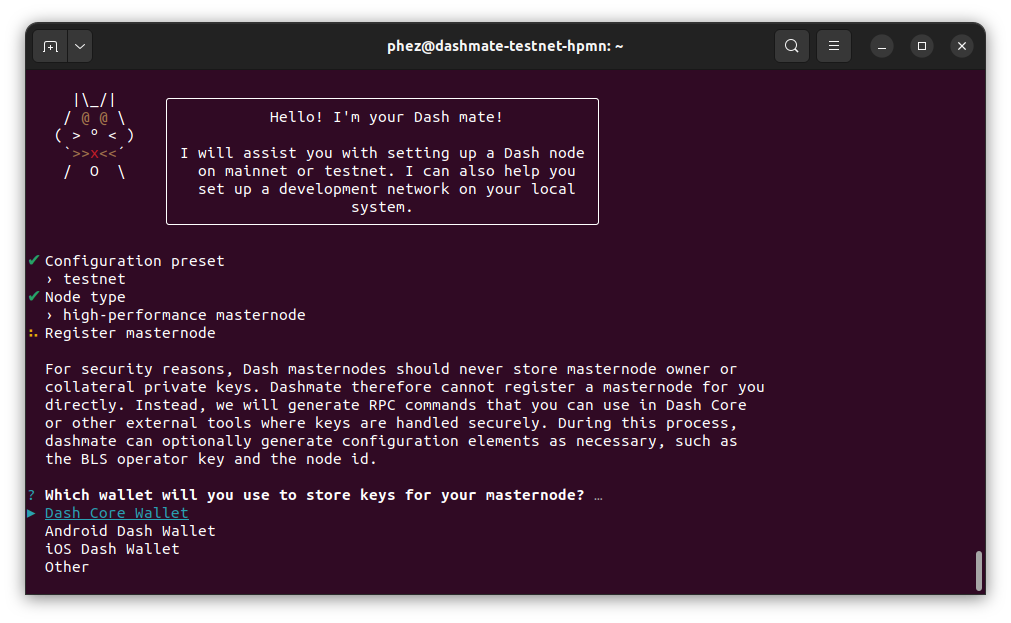
Define Keys and Addresses#
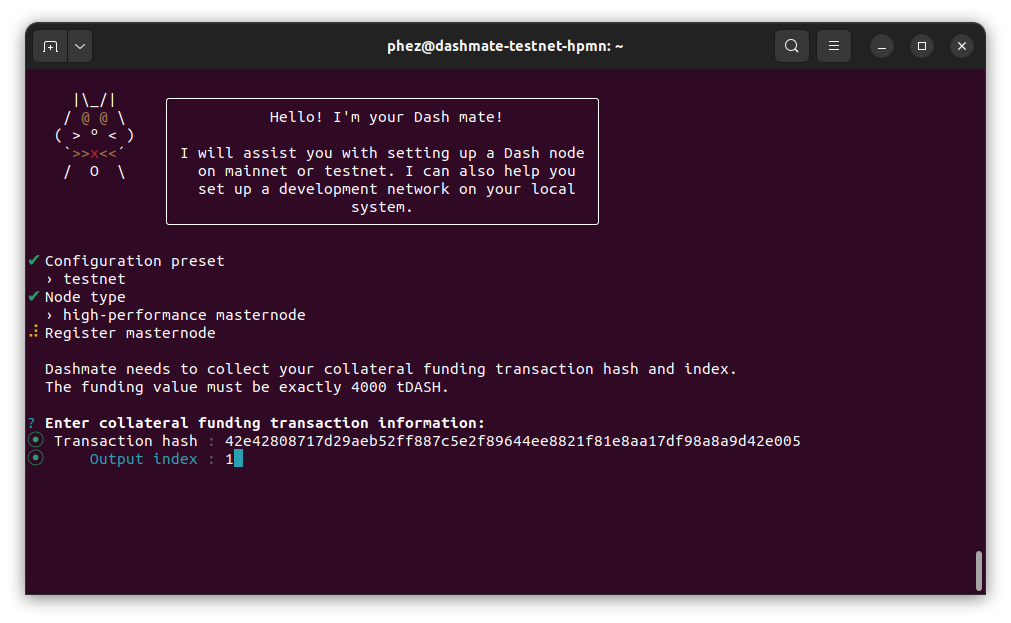
Enter the requested information from your collateral funding transaction. You can find these values using Dash Core’s masternode outputs command.
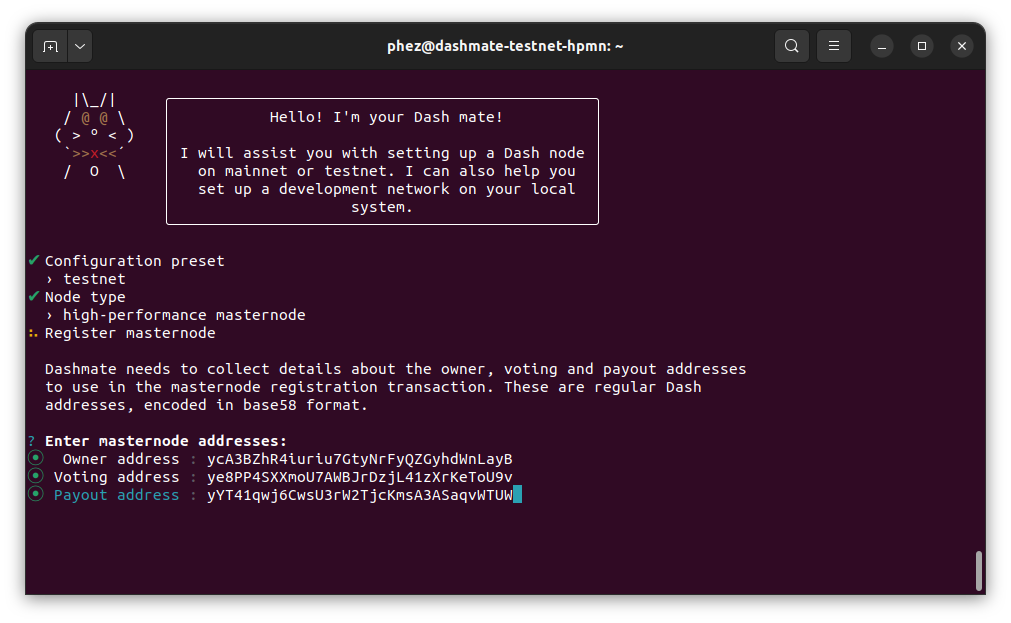
Enter the owner, voting, and payout addresses you generated using Dash Core or your selected wallet.
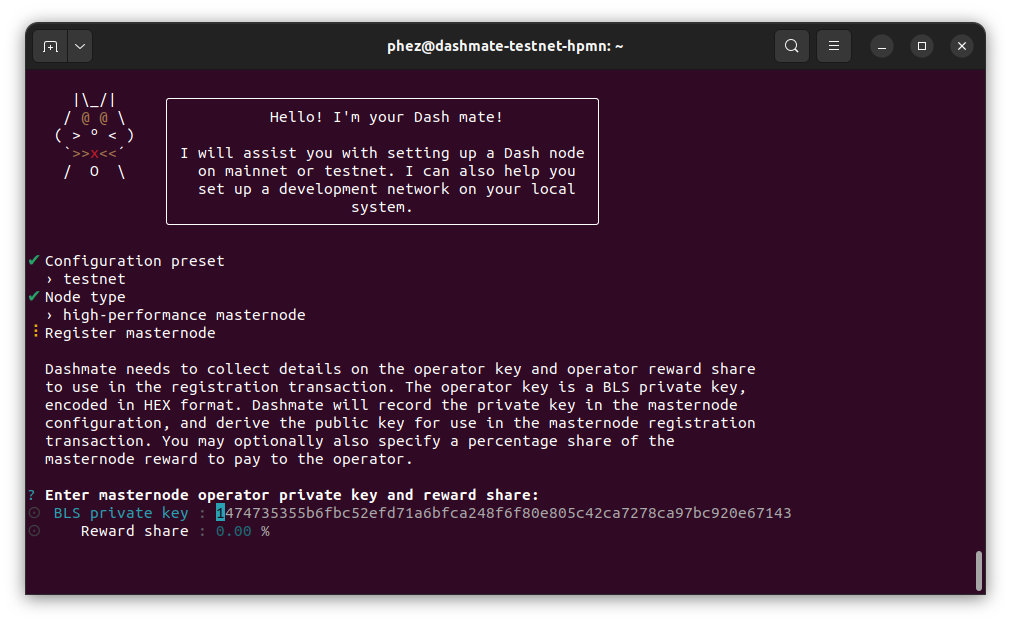
Enter an operator BLS private key. You can enter one you have created (e.g. using Dash Core) or received from a hosting provider. Optionally, use the one automatically generated by dashmate.
If a portion of the masternode rewards are intended to go to the operator directly, set the reward share percentage also.
Note
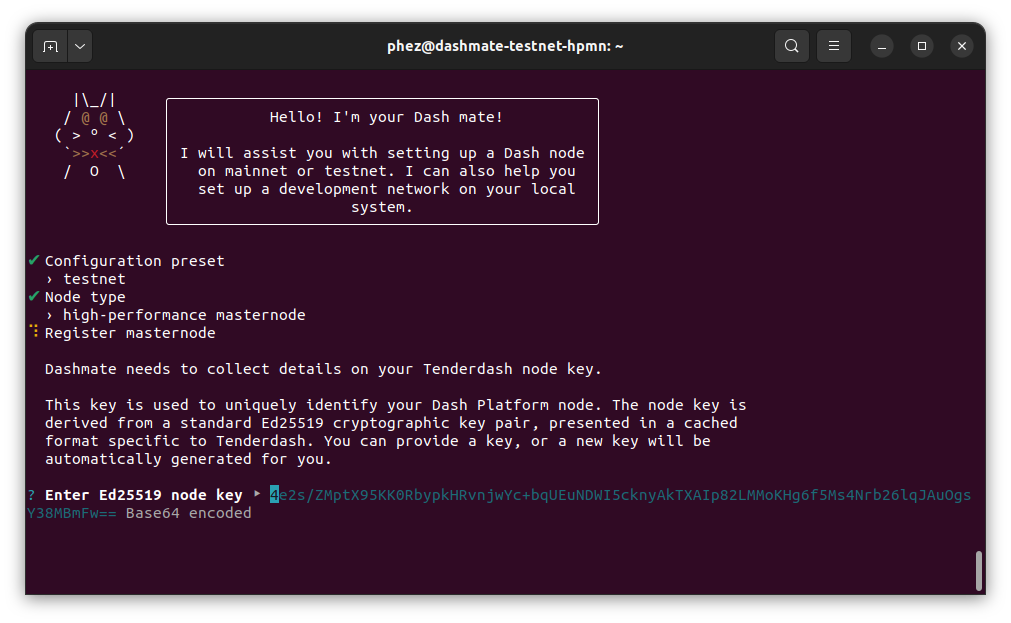
The following step only applies to Evolution masternodes. Regular masternodes do not require a Platform node key since they do not host Platform services.
Enter a Platform node key. You can enter one you have created or received from a hosting provider. Optionally, use the one automatically generated by dashmate.
Configure communication#
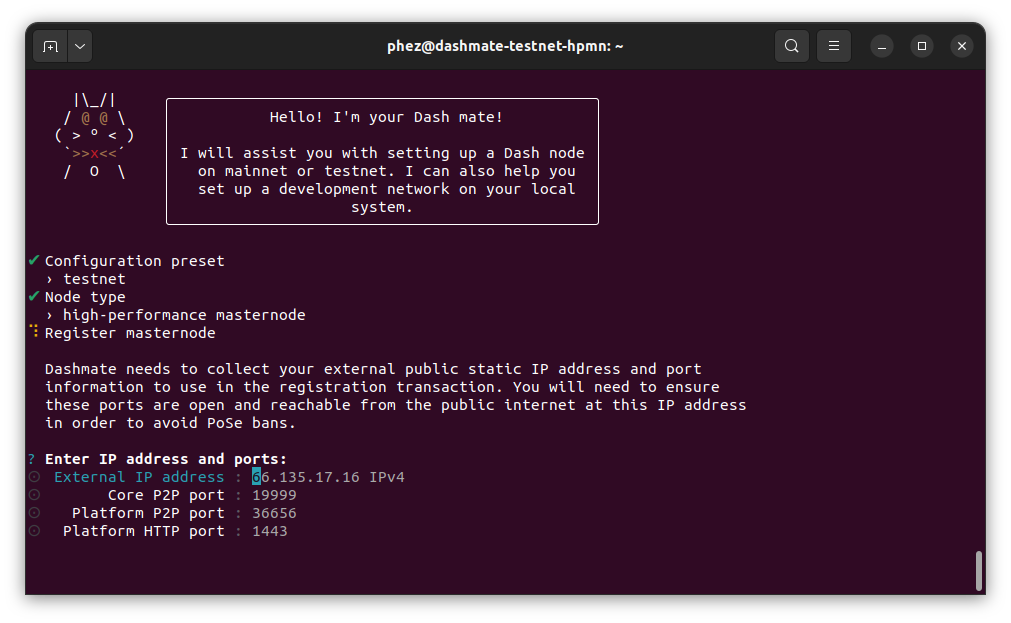
Dashmate will automatically detect the external IP address and select the default ports for the network you are setting up. You can modify these values if necessary for a specific reason, but typically the defaults should be used.
Register the masternode#
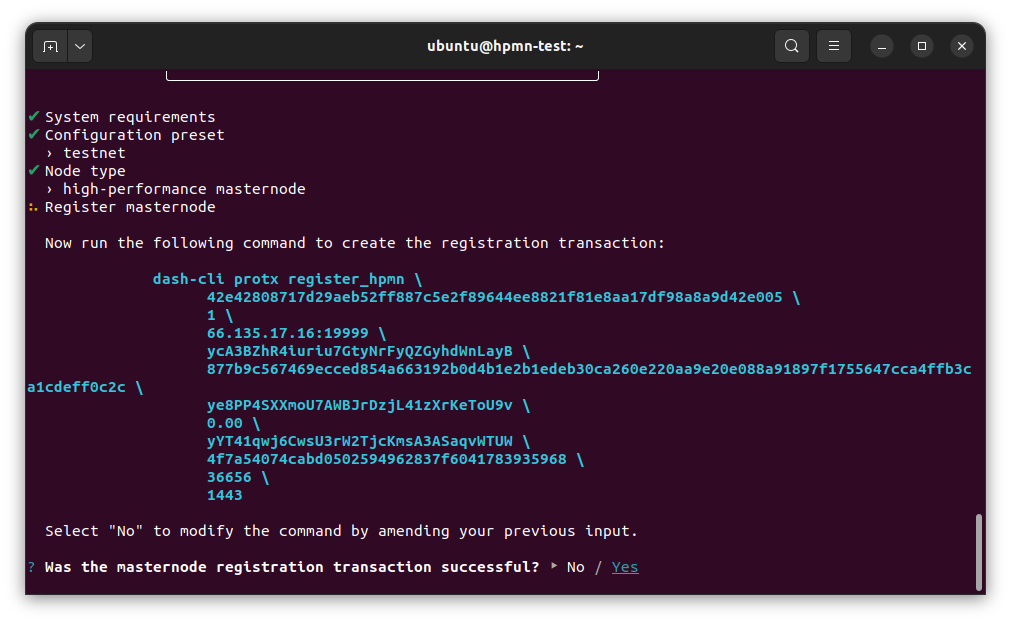
Copy the provided protx command and run it using dash-cli or the Dash Core console. Do note that your payout address must have a balance for the registration process to be successful, so remember to send some DASH to this address before you begin registration.
Select Yes after the command has been run successfully. If you receive an error, select No to go back through the previous steps and review details.
Enable SSL#
Note
The following step only applies to evonodes. Regular masternodes do not require an SSL certificate since they do not host Platform services.
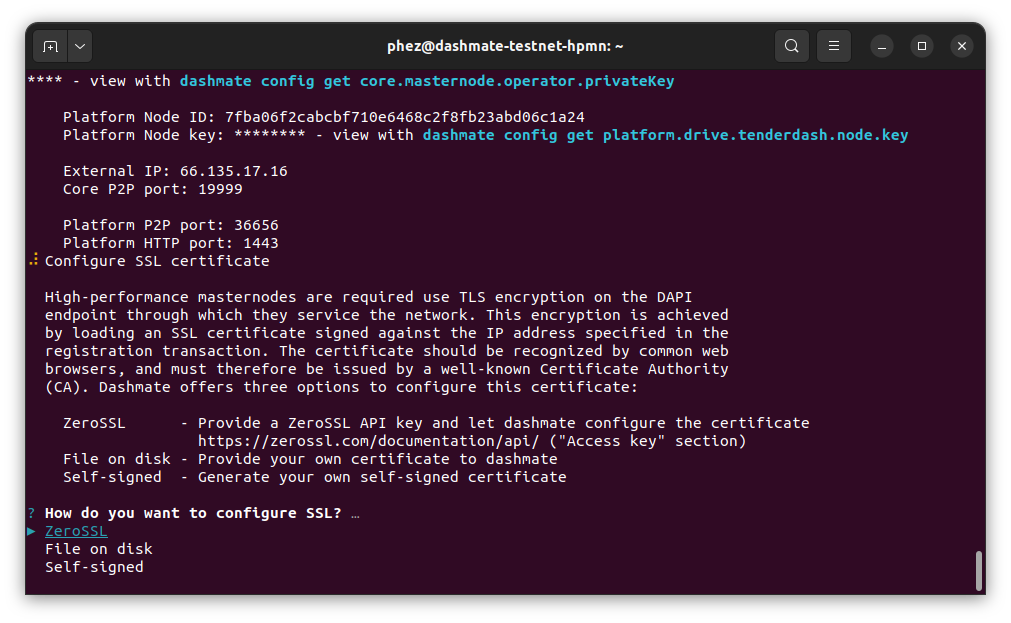
Dash Platform requires SSL for communication. Dashmate provides several options for obtaining the required SSL certificate.
Warning
Self-signed certificates cannot be used on mainnet. When setting up a mainnet evonode, ZeroSSL and File on disk are the only options available.
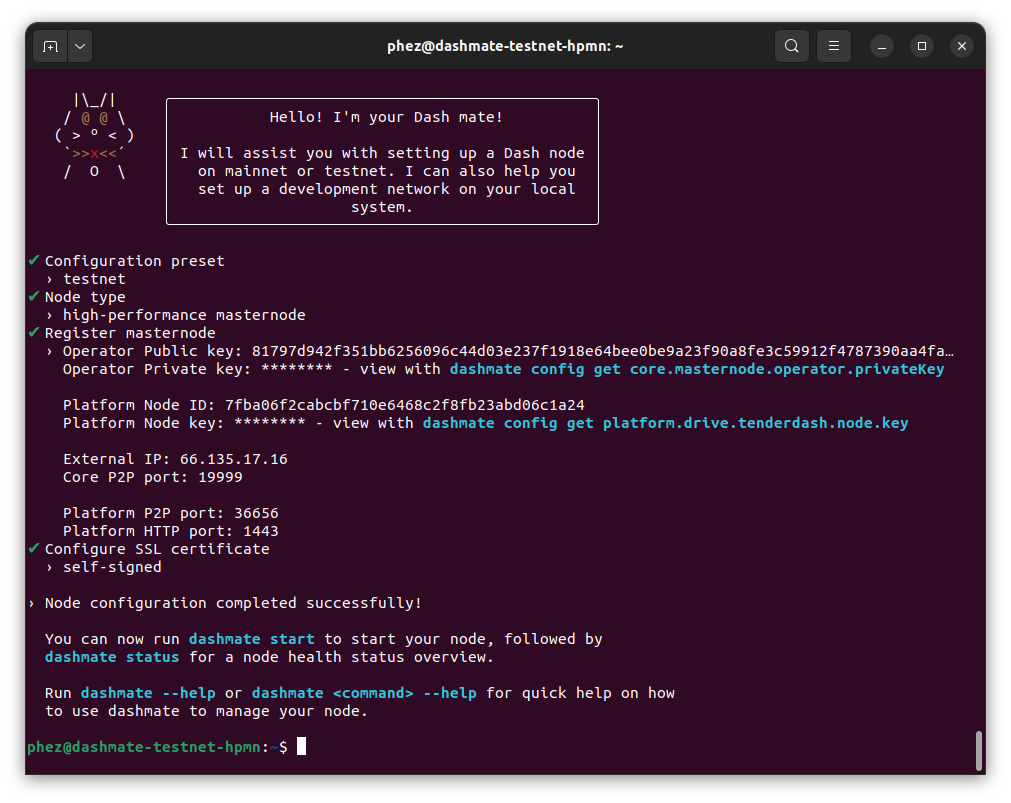
Once the configuration is complete, a summary showing the network and type of node configured is displayed. This summary includes important parameters and information on how to proceed.
Warning
The BLS operator private key and Platform Node key must be backed up and kept secure.
Start the node#
Start your node as follows:
dashmate start
Note
When starting a node for the first time, dashmate will download the Docker images required for each service. The time required for this one-time download will depend on the available bandwidth but typically should complete within a few minutes.
Dashmate node operation#
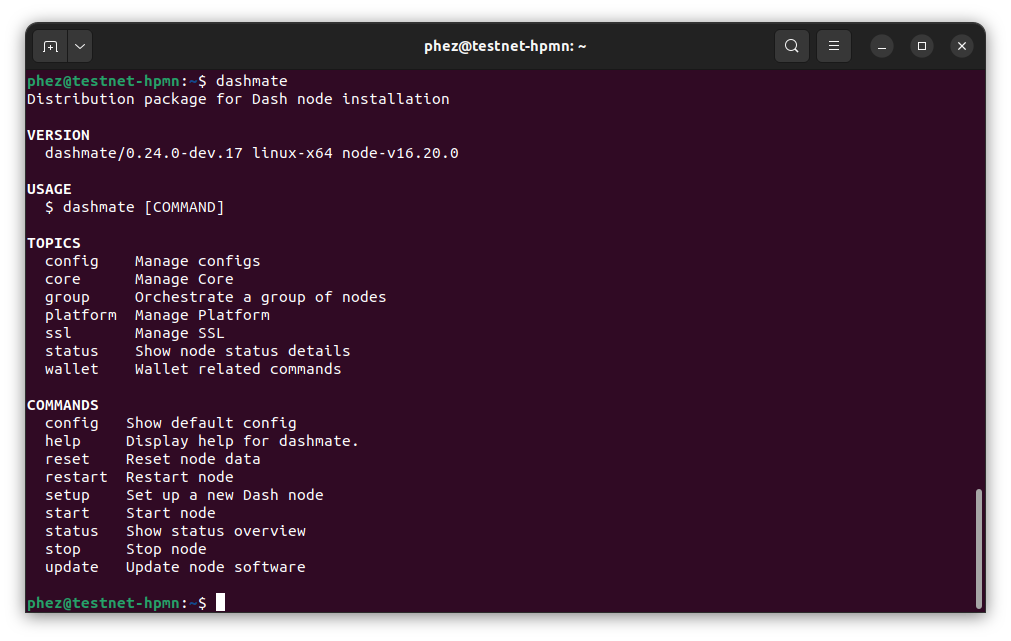
You can manage your masternode status, configuration, and running state entirely from within dashmate. Use the built-in help system to learn more:
dashmate --help
dashmate <command> --help
Start or restart node#
To start your dashmate node, run:
dashmate start
To restart your dashmate node, run:
dashmate restart
Stop node#
To stop your dashmate node, run:
dashmate stop
Node status#
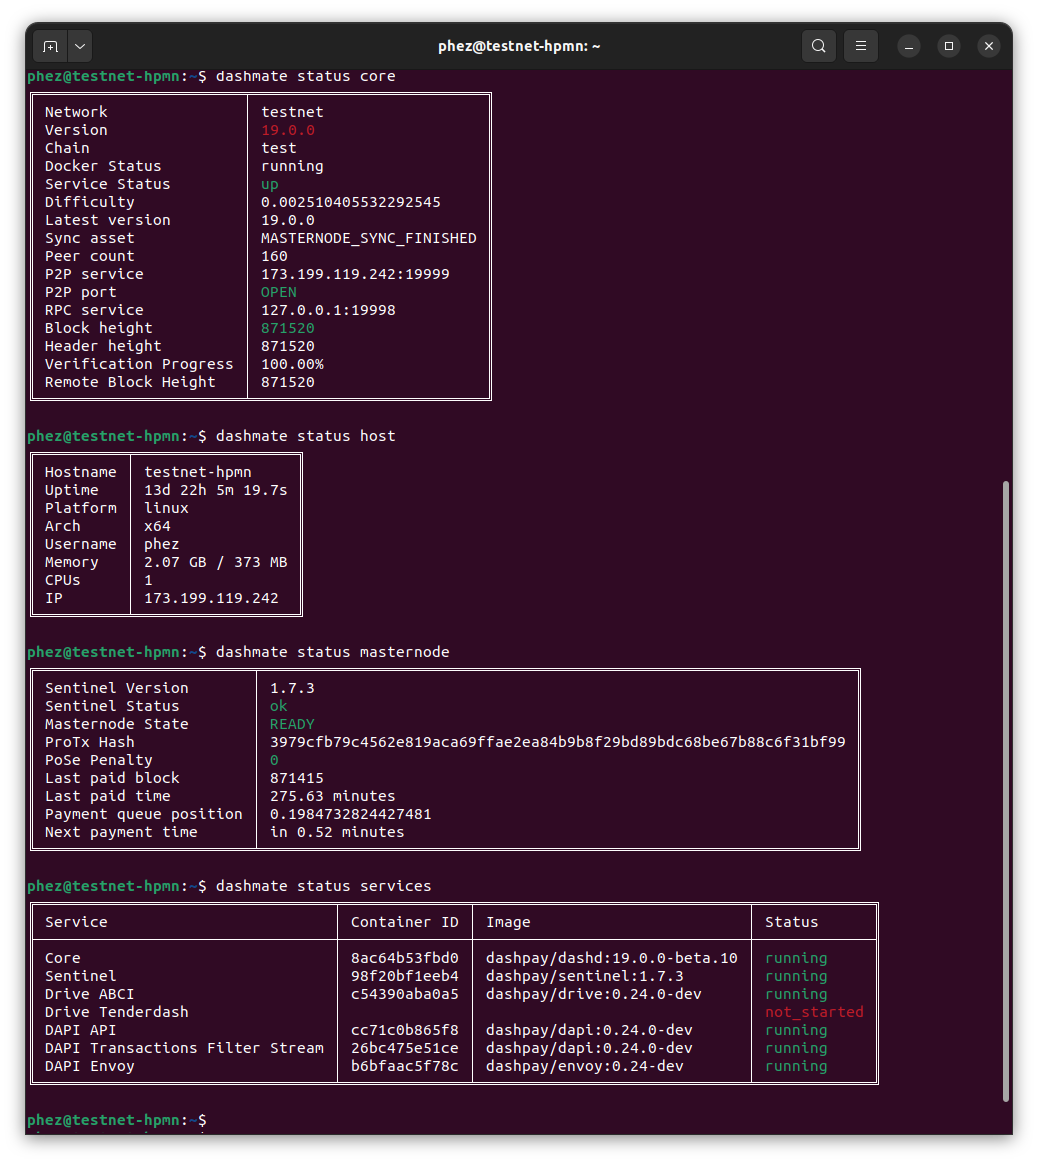
You can check the status of your masternode using the various dashmate
status
commands as follows:
dashmate status
dashmate status core
dashmate status host
dashmate status masternode
dashmate status platform
dashmate status services
Node update#
To update dashmate, it is necessary to download and install the new version of dashmate. First, stop dashmate if it is running:
dashmate stop
Next, install the new version of dashmate following the instructions in the dashmate install section.
Once the new version of dashmate is installed, update dash service docker images:
dashmate update
Finally, restart dashmate:
dashmate start
Troubleshooting#
Warning
Only enable logs if you have configured log rotation to avoid running out of disk space.
The following sections describe how to enable log rotation, set up file logging for Core and Platform, adjust log levels, and collect the logs for analysis.
Dashmate log overview#
Dashmate logs for each service are stored within its Docker container. Although this is typically sufficient, more advanced options are sometimes needed to adjust the log level, output format, or destination. Several cases include when you need to:
Modify the level of detail provided in the logs (e.g., debug vs info)
Provide data to a log server (e.g., Elasticsearch)
Store persistent file logs external to the Docker containers
Use log monitoring tools to track service health
For example, since the default dashmate logs are only stored in the Docker containers, they are lost if the container is removed for some reason (new Docker image, dashmate reset, failure, etc.). Therefore, you may want to store persistent log files external to Docker while troubleshooting an issue to ensure valuable log data cannot be lost.
Set up log rotation#
By default, dashmate logs are not written to the docker host file system. At times you may want to write them to the host file system. Before enabling logging, it is important to configure log rotation to avoid running out of disk space.
Create a new logrotate configuration file for dashmate logs:
sudo nano /etc/logrotate.d/platform-logs
Paste in the following configuration and replace the example path one that matches your system. This example configuration rotates logs daily and retains seven historical files for each log file type. Historical files are each limited to 1GB.
/home/ubuntu/logs/*.log {
rotate 7
daily
maxsize 1G
missingok
notifempty
copytruncate
compress
delaycompress
}
Press Ctrl + X to close the editor and Y and Enter save the file.
Tip
For additional log rotation details, see this configuration tutorial or check out the logrotate man pages.
Configure Core logs#
Enable logging to file#
Use dashmate config set
to configure a location for storing Core logs on the host file system.
Replace the example path with one that matches your system:
dashmate config set core.log.filePath "/home/ubuntu/core-debug.log"
Toggle debug logs#
To enable debug logging for additional details, run the following command. Debug logs can be
turned off by setting the value back to false
:
dashmate config set core.log.debug.enabled true
Advanced debug logging
Dashmate supports some advanced debug log options provided by Dash Core. The following
boolean core.log.debug
settings correspond directly to the parameters described in the Core
documentation:
ips
, sourceLocations
, threadNames
, and timeMicros
.
Setting |
Description |
|
Logs the IP addresses of incoming and outgoing connections |
|
Logs the source locations (file and line number) for debugging information |
|
Logs the names of the threads used for various operations |
|
Logs timestamps with microsecond precision for detailed performance analysis |
Filter Option |
Description |
|
Log only the specified categories (e.g., |
|
Excludes specified categories from logging (e.g., |
dashmate config set core.log.debug.ips true
dashmate config set core.log.debug.includeOnly '["instantsend", "llmq"]'
View current log settings#
To view the current Core log settings, run:
dashmate config get core.log
Disable logging to file#
To disable logging to a file outside the container, reset the log path to null
:
dashmate config set core.log.filePath null
Configure Platform logs#
For troubleshooting flexibility, dashmate provides independent log configuration for the Platform Gateway, Drive ABCI, and Tenderdash. Each service can be configured with the most helpful log level and output format.
Gateway logs#
The Platform gateway has two types of logs: service logs and access logs. Service logs are directed to stdout, while access logs can be configured to go to stdout, stderr, or to a file. If all logs are directed to stdout, the output will be a mixture of service and access data.
Enable file logging
Use dashmate config set
to configure a location for storing Platform gateway access logs on the
host file system. The example below adds file logging while also keeping the default stdout logging.
Replace the example path with one that matches your system:
dashmate config set platform.gateway.log.accessLogs '[
{
"type": "file",
"format": "text",
"path": "/home/ubuntu/logs/gateway.log",
"template": null
},
{
"type": "stdout",
"format": "text",
"template": null
}
]'
Disable file logging
To disable logging to a file, remove the file config from the accessLogs setting:
dashmate config set platform.gateway.log.accessLogs '[
{
"type": "stdout",
"format": "text",
"template": null
}
]'
Change log level
Platform gateway service logs support several levels of detail. In increasing order of detail they
are: critical
, error
, warn
, info
(default), debug
, and trace
. To disable
service logs, set the log level to off
.
The log level can be changed by using dashmate config set
to update the
platform.gateway.log.level
value. For example, run these commands to change the gateway service
log level to debug on your dashmate node:
dashmate config set platform.gateway.log.level debug
dashmate restart --platform
View log settings
To view the current Platform gateway log settings, run:
dashmate config get platform.gateway.log
Drive ABCI logs#
Enable file logging
Use dashmate config set
to configure a location for storing Platform ABCI logs on the host
file system. Replace the example path with one that matches your system:
dashmate config set platform.drive.abci.logs '{
"stdout": {
"destination":"stdout",
"level": "info",
"format":"compact",
"color":true
},
"file": {
"destination": "/home/ubuntu/logs/drive-abci.log",
"level": "info",
"format": "compact",
"color": true
}
}'
Disable file logging
To disable logging to a file, remove the file config from the logs setting:
dashmate config set platform.drive.abci.logs '{
"stdout": {
"destination":"stdout",
"level": "info",
"format":"compact",
"color":true
}
}'
Change log level
Drive ABCI logs support several levels of detail. In increasing order of detail they are: error
,
warn
, info
(default), debug
, and trace
. A logging specification string can also be
provided in the RUST_LOG format for more flexibility. To disable service logs, set the log level to
silent
.
The log level can be changed by using dashmate config set
to update the
platform.drive.abci.logs.*.level
value. For example, run these commands to change the log levels
for file logging and stdout logging to debug on your dashmate node:
dashmate config set platform.drive.abci.logs.file.level debug
dashmate config set platform.drive.abci.logs.stdout.level debug
dashmate restart --platform
View log settings
To view the current Platform gateway log settings, run:
dashmate config get platform.drive.abci.logs
Tenderdash logs#
Enable file logging
Use dashmate config set
to configure a location for storing Tenderdash logs on the host file
system. Replace the example path with one that matches your system:
dashmate config set platform.drive.tenderdash.log.path "/home/ubuntu/logs/drive-tenderdash.log"
Disable file logging
To disable logging to a file, set the path back to null
:
dashmate config set platform.drive.tenderdash.log.path null
Change log level
Tenderdash logs support several levels of detail. In increasing order of detail they are:
error
, warn
, info
(default), debug
, and trace
. A logging
specification string can also be provided in the RUST_LOG format for more flexibility. To disable
service logs, set the log level to silent
.
The log level can be changed by using dashmate config set
to update the
platform.drive.abci.logs.*.level
value. For example, run these commands to change the log level
to debug on your dashmate node:
dashmate config set platform.drive.tenderdash.log.level debug
dashmate restart --platform
View log settings
To view the current Tenderdash log settings, run:
dashmate config get platform.drive.tenderdash.log
Collect logs#
Dashmate includes the doctor command to make troubleshooting and log reporting easier. The dashmate doctor command collects important debugging data about the masternode and creates a compressed report file that can be sent to the support team if necessary. This report includes:
Operating System: Details about the architecture, CPU, memory, and swap
Docker: Status and logs (exit codes, stdout, stderr) for each service
Core RPC: Essential details like the best ChainLock, quorums, blockchain information, peers, and masternode status
Tenderdash RPC: Status, genesis, network information, ABCI details, and a consensus state dump
Metrics: Tenderdash and Drive metrics (if enabled in the configuration)
To create a report, run dashmate doctor
and select Yes:
dashmate doctor
Upon successful completion, the full path to the report archive is displayed.
Metrics#
To provide better network visibility to DCG developers for troubleshooting, volunteers can contribute metrics to the DCG metrics server.
Enable metrics on your dashmate node
dashmate config set platform.gateway.metrics.enabled true dashmate config set platform.gateway.metrics.host 0.0.0.0 dashmate config set platform.gateway.metrics.port 9090 dashmate config set platform.gateway.admin.enabled true dashmate config set platform.gateway.rateLimiter.metrics.enabled true dashmate config set platform.gateway.rateLimiter.metrics.host 0.0.0.0 dashmate config set platform.gateway.rateLimiter.metrics.port 9102 dashmate config set platform.drive.abci.metrics.enabled true dashmate config set platform.drive.abci.metrics.host 0.0.0.0 dashmate config set platform.drive.abci.metrics.port 29090 dashmate config set platform.drive.tenderdash.metrics.enabled true dashmate config set platform.drive.tenderdash.metrics.host 0.0.0.0 dashmate config set platform.drive.tenderdash.metrics.port 26660 dashmate restart --platform
Grant access to metrics from the DCG metrics server (34.219.3.238) by updating your network configuration (i.e., your firewall, AWS security groups, etc.)
Provide DCG with your IP address and port so it can be added to the DCG Prometheus server
Additional Information#
For further documentation see the dashmate repository.