Dashmate#
Dashmate è uno strumento universale progettato per aiutarti a configurare ed eseguire i masternode Dash in un ambiente containerizzato. È anche uno strumento ideale per configurare ed eseguire rapidamente e facilmente una rete di sviluppo sul tuo sistema locale.
Configurazione di questo evonode in Testnet utilizzando dashmate#
Installazione#
This guide describes how to download, install and use dashmate on for Linux. The guide is written for Ubuntu 22.04 x64 LTS, but the steps should be similar for other Linux distributions.
Installa le dipendenze#
Installa e configura Docker:
curl -fsSL https://get.docker.com -o get-docker.sh && sh ./get-docker.sh
sudo usermod -aG docker $USER
newgrp docker
Installa dashmate#
There are several methods available for installing dashmate. Installing the Linux, MacOS, or Windows packages from the GitHub releases page is recommended for mainnet masternodes.
Pacchetto Debian#
Download the newest dashmate installation package for your architecture from the GitHub releases page:
wget https://github.com/dashpay/platform/releases/download/v4.0.0/dashmate_4.0.0.9f9092cc91-1_amd64.deb
Installa Dashmate utilizzando apt:
sudo apt update
sudo apt install ./dashmate_4.0.0.9f9092cc91-1_amd64.deb
Nota
At the end of the installation process, apt may display an error due to installing a downloaded package. You can ignore this error message:
N: Download is performed unsandboxed as root as file '/home/ubuntu/dashmate_4.0.0.9f9092cc91-1_amd64.deb' couldn't be accessed by user '_apt'. - pkgAcquire::Run (13: Permission denied)
Pacchetto nodo#
Avvertimento
This installation option is not recommended for mainnet masternodes. Please install packages from the GitHub releases page.
Node.js dashmate install
Per installare il pacchetto NodeJS, è necessario prima installare NodeJS. Ti consigliamo di installarlo utilizzando nvm:
curl -o- https://raw.githubusercontent.com/nvm-sh/nvm/v0.39.5/install.sh | bash
source ~/.bashrc
nvm install 20
Una volta installato NodeJS, utilizza npm per installare dashmate:
npm install -g dashmate
Configurazione del masternode#
Dashmate is primarily recommended for setting up Evolution masternodes (evonodes). With the exception of a few minor extra steps for evonodes, the process is identical for evonodes and regular masternodes. Complete the steps in the sections below to set up your node or follow along with this step-by-step tutorial.
Per iniziare la configurazione del masternode, esegui dashmate setup per avviare la procedura guidata interattiva:
dashmate setup
Imposta la rete e il tipo di nodo#
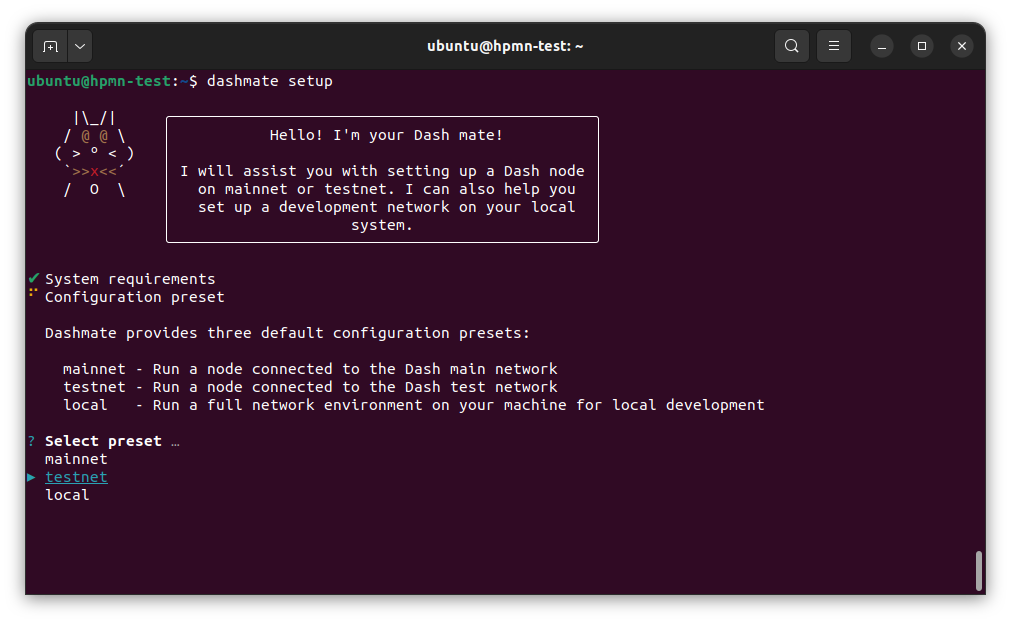
Seleziona la preimpostazione della rete testnet#
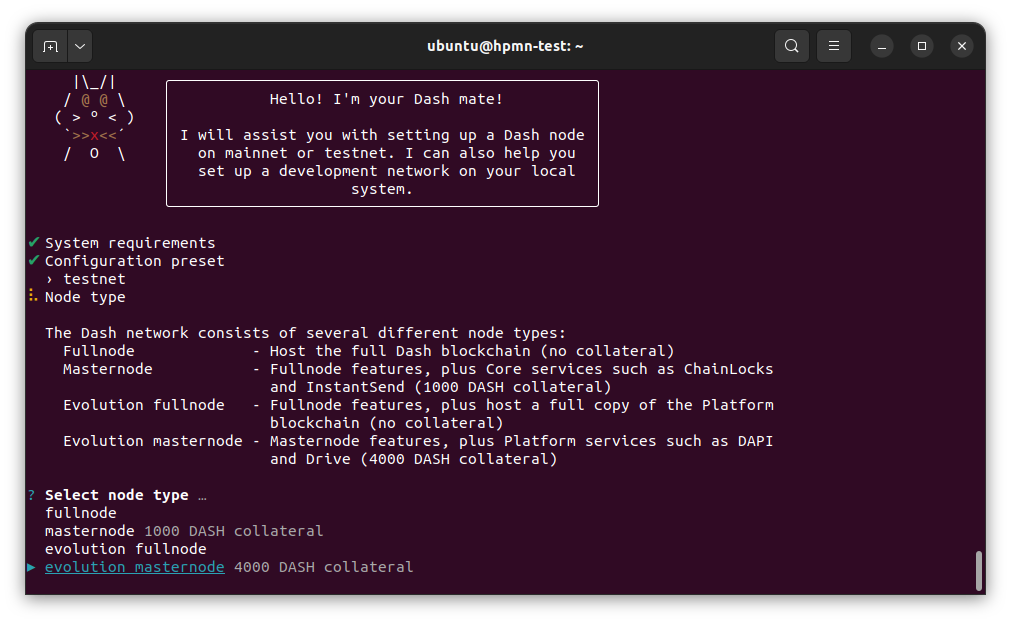
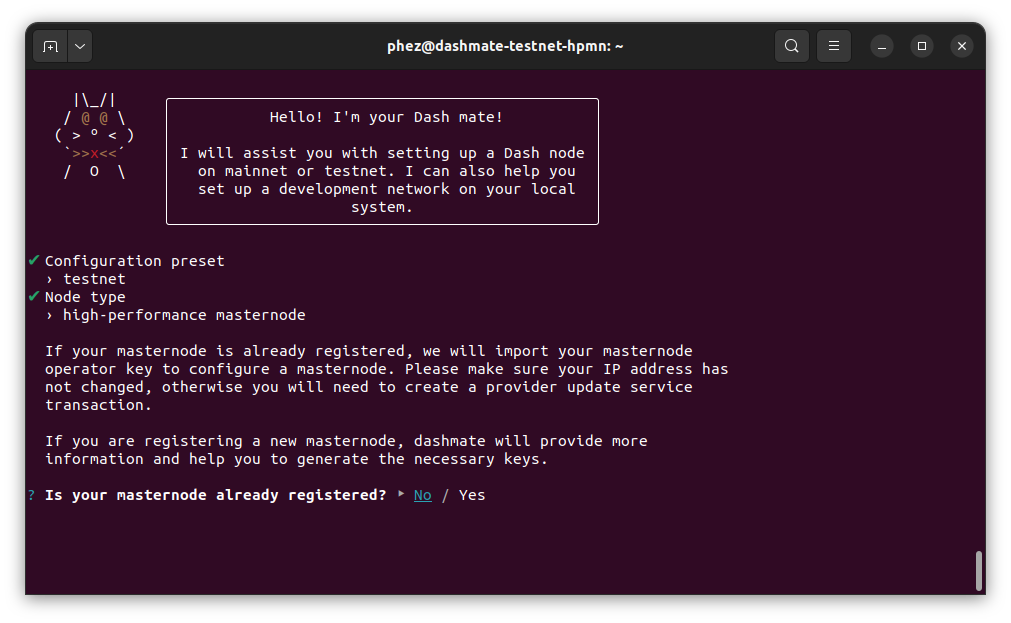
Crea un masternode Evolution#
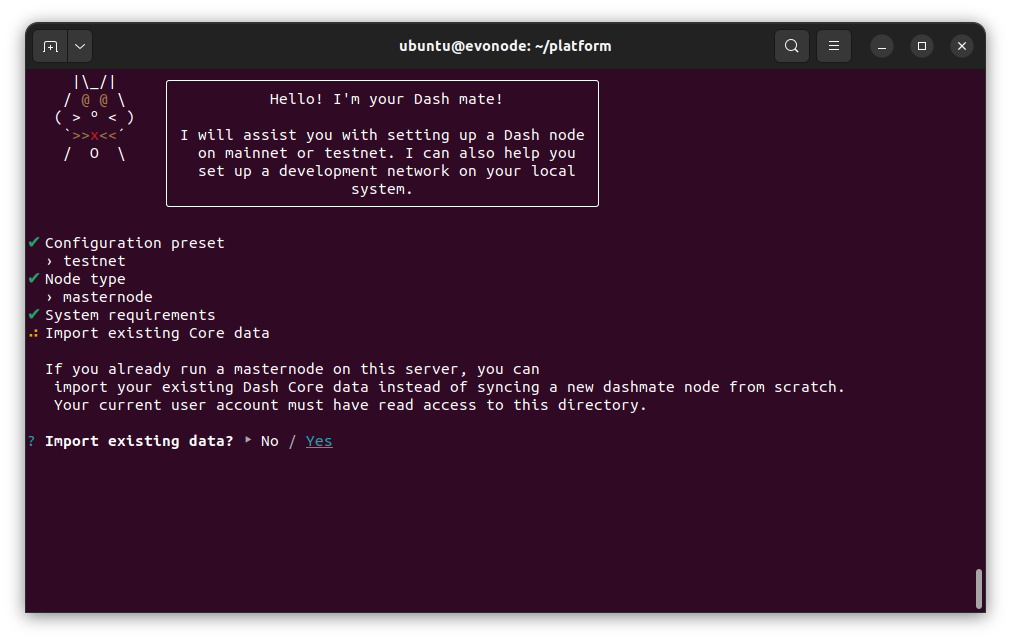
Seleziona No per registrare un nuovo masternode o Sì per importare informazioni su un masternode esistente.
Configura un nuovo masternode#
If registering a new masternode, jump to the defining keys and addresses section next.
Import existing Core data#
Nota
The following step only applies when migrating an existing masternode into dashmate.
If you chose to import an existing masternode in the previous step, you will be prompted for the location of your existing installation.
Import existing data#
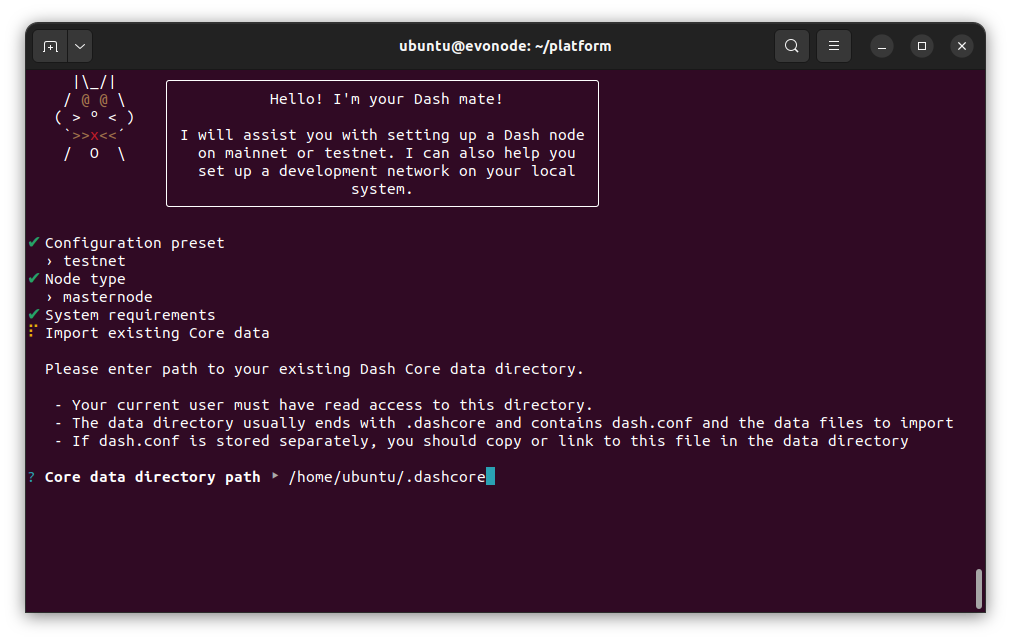
Enter existing Core data directory#
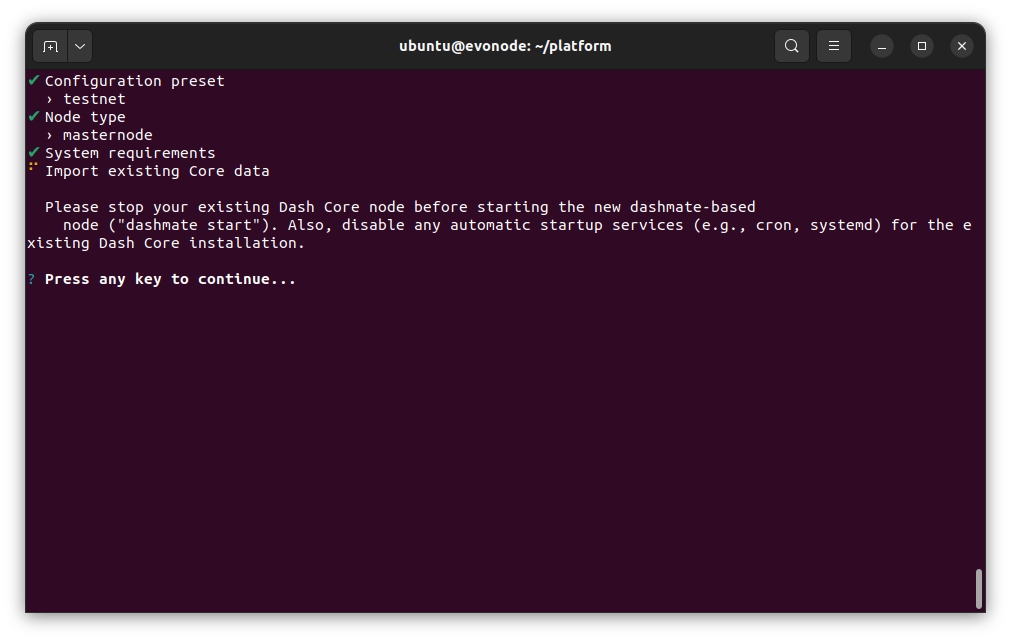
Core data import complete#
Once the Core data has been imported, jump to the configure communication section.
Definire chiavi e indirizzi#
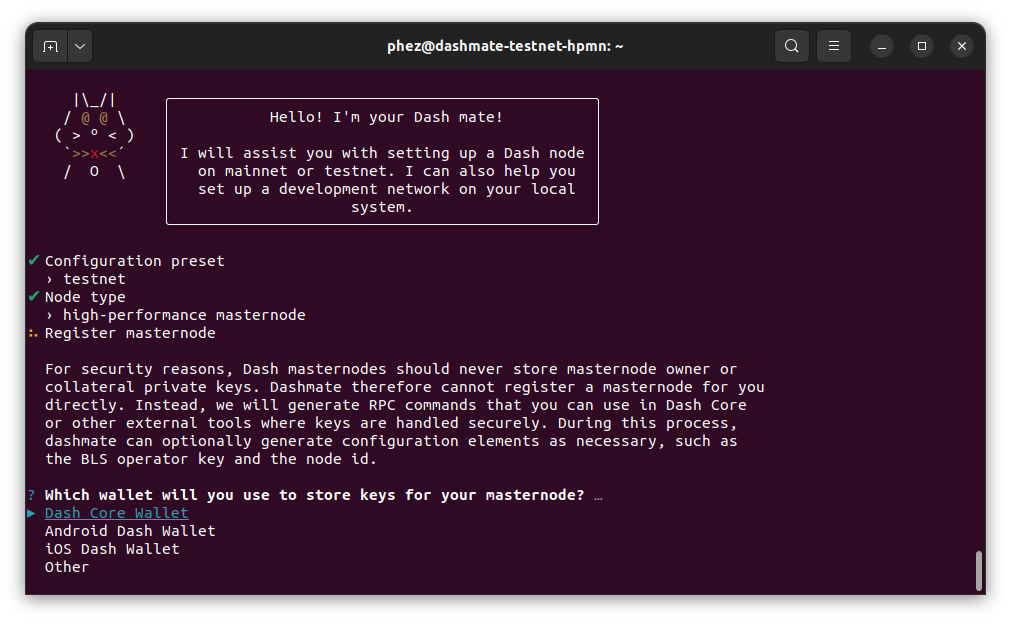
Memorizza le chiavi masternode in Dash Core#
Inserisci le informazioni richieste dal tuo transazione di finanziamento collaterale. Puoi trovare questi valori utilizzando il comando masternode outputs di Dash Core.
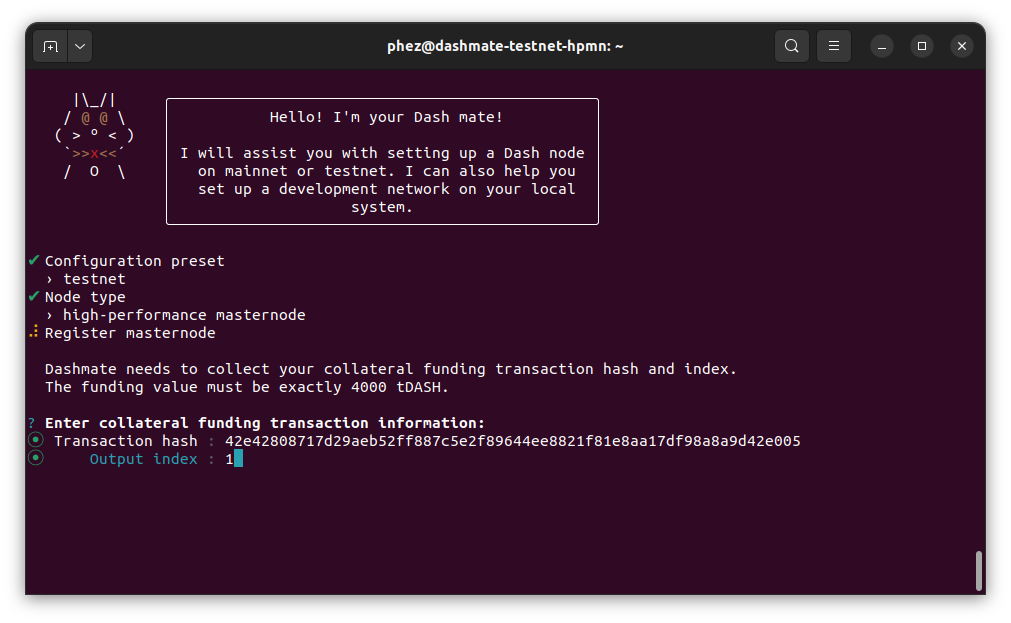
Inserisci le informazioni sulla transazione collaterale#
Inserisci gli indirizzi del proprietario, della votazione e del pagamento generati utilizzando Dash Core o il tuo wallet selezionato.
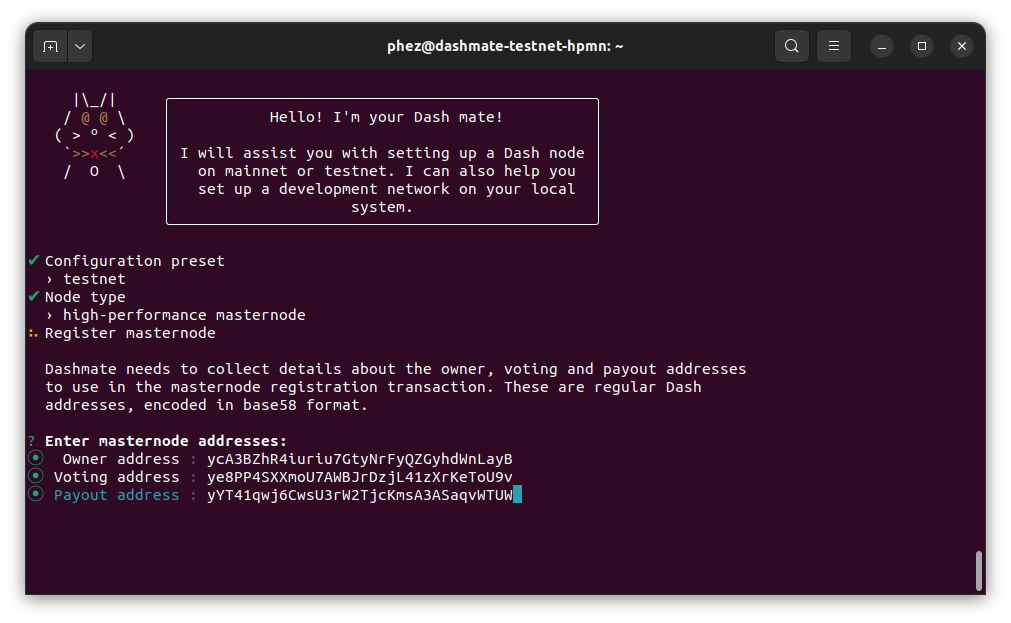
Inserisci gli indirizzi masternode#
Immettere una chiave privata BLS dell’operatore. Puoi inserirne uno che hai creato (ad esempio using Dash Core) o ricevuto da un provider di hosting. Facoltativamente, utilizza quello generato automaticamente da Dashmate.
Se una parte dei premi masternode è destinata ad andare direttamente all’operatore, imposta anche la percentuale di condivisione del premio.
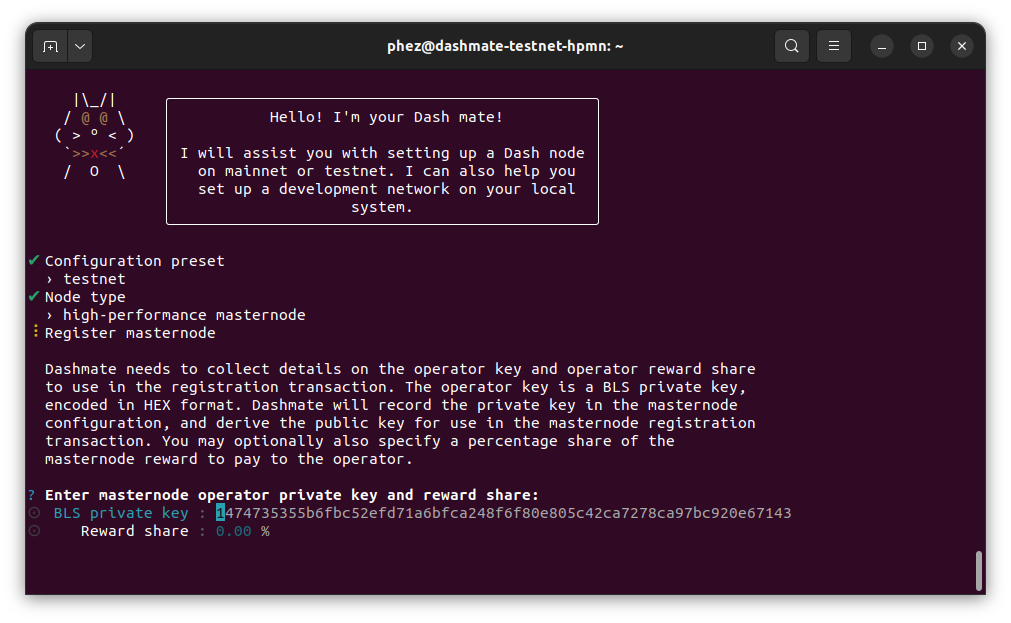
Inserisci le informazioni dell’operatore#
Nota
Il passaggio seguente si applica solo ai masternode Evolution. I masternode regolari non richiedono una chiave di nodo della Platform poiché non ospitano i servizi della Platform.
Immettere una chiave di nodo della platform. Puoi inserirne uno che hai creato o ricevuto da un provider di hosting. Facoltativamente, utilizza quello generato automaticamente da Dashmate.
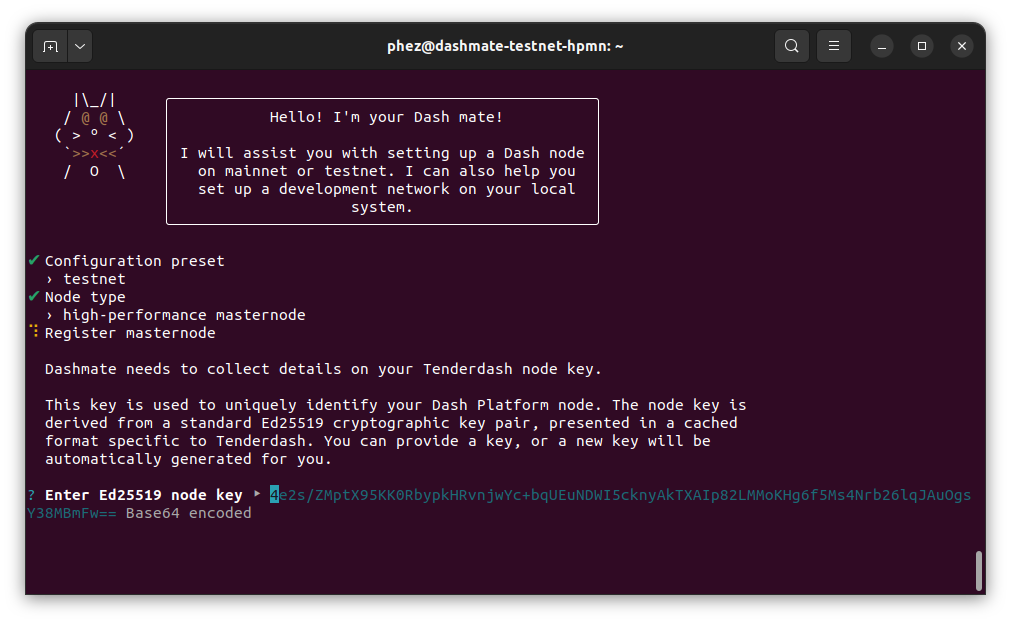
Immettere la chiave del nodo Platform#
Configurare la comunicazione#
Dashmate rileverà automaticamente l’indirizzo IP esterno e selezionerà le porte predefinite per la rete che stai configurando. È possibile modificare questi valori se necessario per un motivo specifico, ma in genere è necessario utilizzare i valori predefiniti.
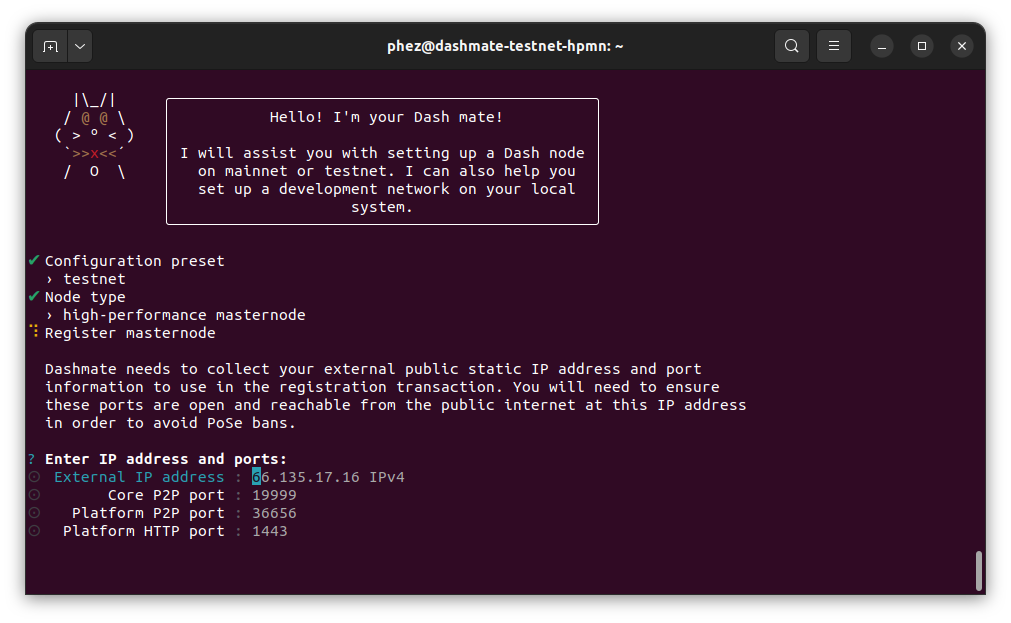
Inserisci le informazioni di connessione#
Registra il masternode#
Copia il comando protx fornito ed eseguilo utilizzando dash-cli o la console Dash Core. Tieni presente che il tuo indirizzo di pagamento deve avere un saldo affinché il processo di registrazione abbia esito positivo, quindi ricorda di inviare alcuni DASH a questo indirizzo prima di iniziare la registrazione.
Selezionare Sì dopo che il comando è stato eseguito correttamente. Se ricevi un errore, seleziona No per tornare ai passaggi precedenti ed esaminare i dettagli.
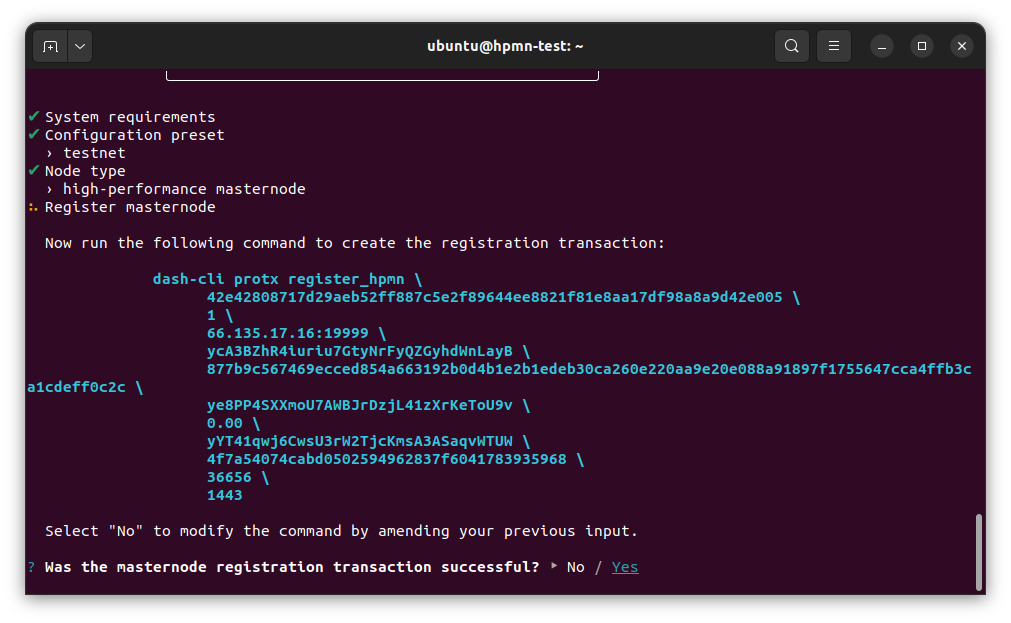
Esegui il comando di registrazione#
Abilita SSL#
Nota
Il passaggio seguente si applica solo agli evonodi. I masternode regolari non richiedono un certificato SSL poiché non ospitano i servizi della platform.
La Platform Dash richiede SSL per la comunicazione. Dashmate offre diverse opzioni per ottenere il certificato SSL richiesto.
Avvertimento
I certificati autofirmati non possono essere utilizzati sulla mainnet. Quando si configura un evonode della rete principale, ZeroSSL e File su disco sono le uniche opzioni disponibili.
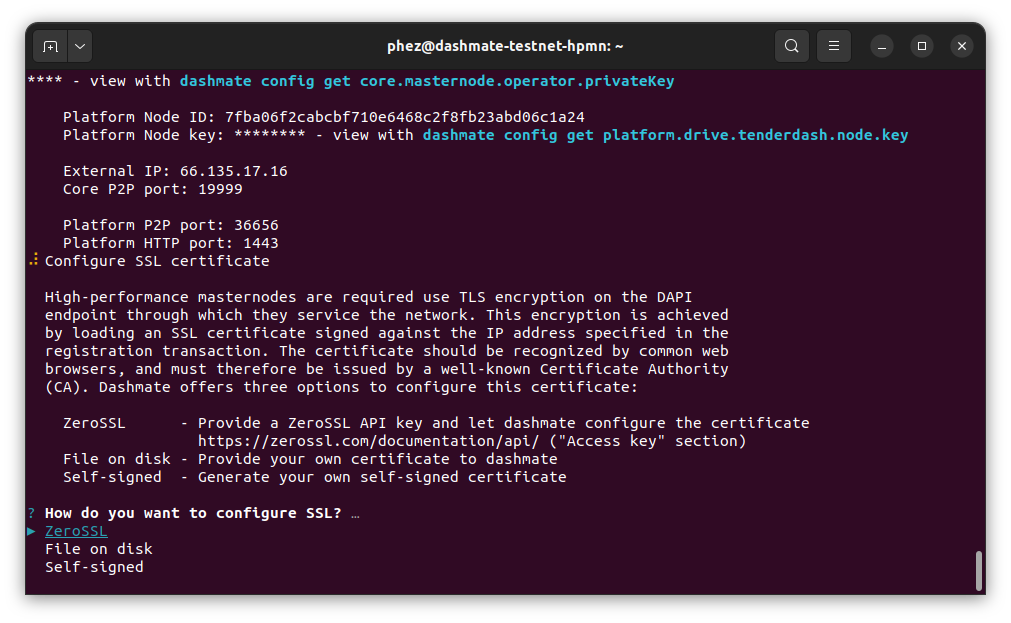
Configura SSL#
Una volta completata la configurazione viene visualizzato un riepilogo che mostra la rete e la tipologia di nodo configurato. Questo riepilogo include parametri importanti e informazioni su come procedere.
Avvertimento
È necessario eseguire il backup della chiave privata dell’operatore BLS e della chiave del nodo della Platform e mantenerle al sicuro.
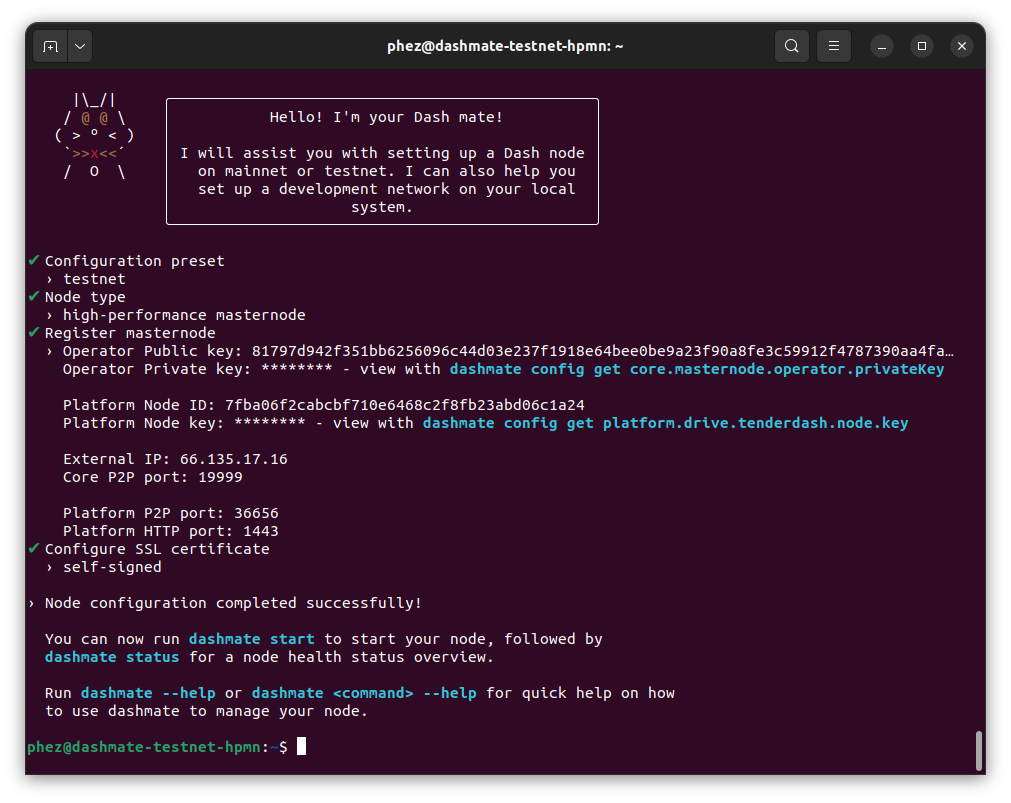
Configurazione completata! 🎉#
Avvia il nodo#
Avvia il tuo nodo come segue:
dashmate start
Nota
Quando si avvia un nodo per la prima volta, Dashmate scaricherà le immagini Docker richieste per ciascun servizio. Il tempo necessario per questo download una tantum dipenderà dalla larghezza di banda disponibile, ma in genere dovrebbe essere completato in pochi minuti.
Decima operazione sul nodo#
Puoi gestire lo stato, la configurazione e lo stato di esecuzione del tuo masternode interamente da Dashmate. Utilizza il sistema di aiuto integrato per saperne di più:
dashmate --helpdashmate <command> --help
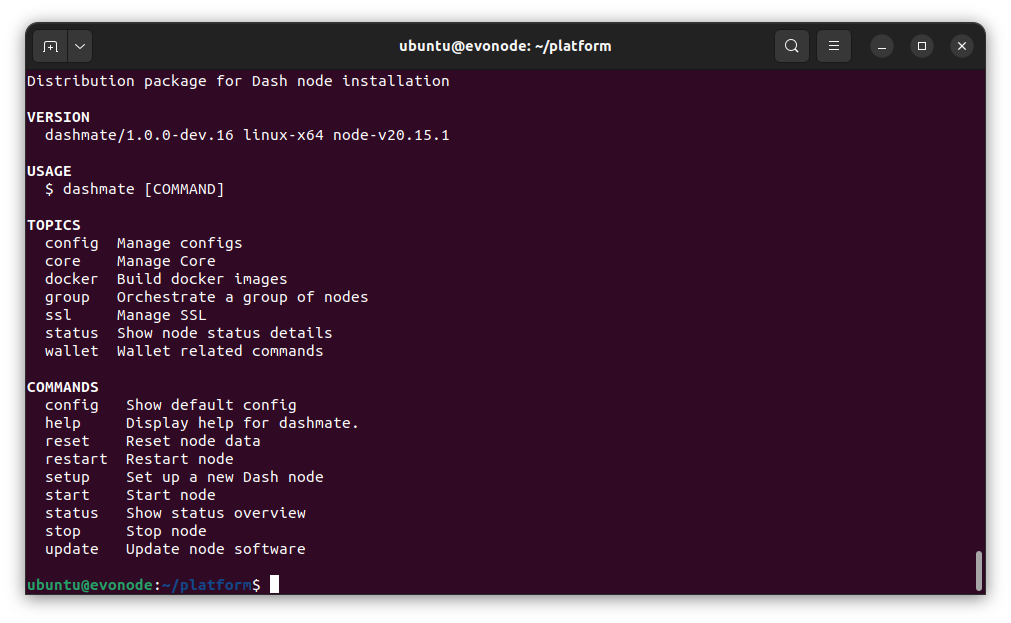
Dashmate mostra l’output della guida di livello superiore#
Avvia o riavvia il nodo#
Per avviare il tuo nodo Dashmate, esegui:
dashmate start
Per riavviare il tuo nodo Dashmate, esegui:
dashmate restart
Ferma il nodo#
Per interrompere il tuo nodo Dashmate, esegui:
dashmate stop
Stato del nodo#
Puoi controllare lo stato del tuo masternode utilizzando i vari comandi dashmate status come segue:
dashmate status
dashmate status core
dashmate status host
dashmate status masternode
dashmate status platform
dashmate status services
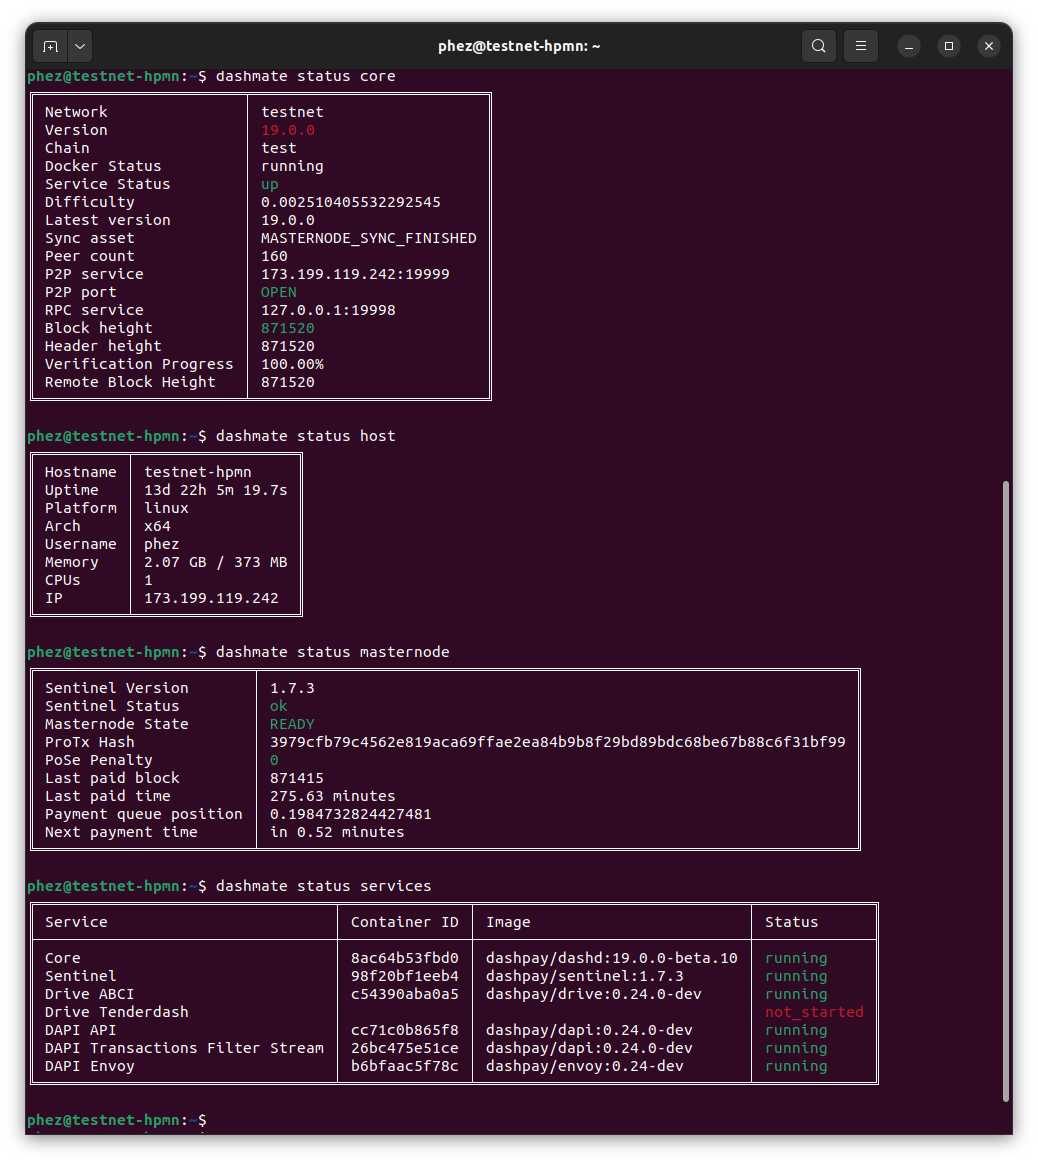
Dashmate mostra una serie di output di stato#
Aggiornamento del nodo#
To update dashmate, it is necessary to download and install the new version of dashmate. First, stop dashmate if it is running:
dashmate stop
Next, install the new version of dashmate following the instructions in the dashmate install section.
Once the new version of dashmate is installed, update dash service docker images:
dashmate update
Finally, restart dashmate:
dashmate start
Troubleshooting#
Avvertimento
Only enable logs if you have configured log rotation to avoid running out of disk space.
The following sections describe how to enable log rotation, set up file logging for Core and Platform, adjust log levels, and collect the logs for analysis.
Dashmate log overview#
Dashmate logs for each service are stored within its Docker container. Although this is typically sufficient, more advanced options are sometimes needed to adjust the log level, output format, or destination. Several cases include when you need to:
Modify the level of detail provided in the logs (e.g., debug vs info)
Provide data to a log server (e.g., Elasticsearch)
Store persistent file logs external to the Docker containers
Use log monitoring tools to track service health
For example, since the default dashmate logs are only stored in the Docker containers, they are lost if the container is removed for some reason (new Docker image, dashmate reset, failure, etc.). Therefore, you may want to store persistent log files external to Docker while troubleshooting an issue to ensure valuable log data cannot be lost.
Set up log rotation#
By default, dashmate logs are not written to the docker host file system. At times you may want to write them to the host file system. Before enabling logging, it is important to configure log rotation to avoid running out of disk space.
Create a new logrotate configuration file for dashmate logs:
sudo nano /etc/logrotate.d/platform-logs
Paste in the following configuration and replace the example path one that matches your system. This example configuration rotates logs daily and retains seven historical files for each log file type. Historical files are each limited to 1GB.
/home/ubuntu/logs/*.log {
  rotate 7
  daily
  maxsize 1G
  missingok
  notifempty
  copytruncate
  compress
  delaycompress
}
Press Ctrl + X to close the editor and Y and Enter save the file.
Suggerimento
For additional log rotation details, see this configuration tutorial or check out the logrotate man pages.
Configure Core logs#
Enable logging to file#
Use dashmate config set to configure a location for storing Core logs on the host file system.
Replace the example path with one that matches your system:
dashmate config set core.log.filePath "/home/ubuntu/core-debug.log"
Toggle debug logs#
To enable debug logging for additional details, run the following command. Debug logs can be
turned off by setting the value back to false:
dashmate config set core.log.debug.enabled true
Advanced debug logging
Dashmate supports some advanced debug log options provided by Dash Core. The following
boolean core.log.debug settings correspond directly to the parameters described in the Core
documentation:
ips, sourceLocations, threadNames, and timeMicros.
Dashmate Debug Log Options
Setting |
Description |
|
Logs the IP addresses of incoming and outgoing connections |
|
Logs the source locations (file and line number) for debugging information |
|
Logs the names of the threads used for various operations |
|
Logs timestamps with microsecond precision for detailed performance analysis |
Filter Option |
Description |
|
Log only the specified categories (e.g., |
|
Excludes specified categories from logging (e.g., |
dashmate config set core.log.debug.ips true
dashmate config set core.log.debug.includeOnly '["instantsend", "llmq"]'
View current log settings#
To view the current Core log settings, run:
dashmate config get core.log
Disable logging to file#
To disable logging to a file outside the container, reset the log path to null:
dashmate config set core.log.filePath null
Configure Platform logs#
For troubleshooting flexibility, dashmate provides independent log configuration for the Platform Gateway, Drive ABCI, and Tenderdash. Each service can be configured with the most helpful log level and output format.
Gateway logs#
The Platform gateway has two types of logs: service logs and access logs. Service logs are directed to stdout, while access logs can be configured to go to stdout, stderr, or to a file. If all logs are directed to stdout, the output will be a mixture of service and access data.
Enable file logging
Use dashmate config set to configure a location for storing Platform gateway access logs on the
host file system. The example below adds file logging while also keeping the default stdout logging.
Replace the example path with one that matches your system:
dashmate config set platform.gateway.log.accessLogs '[
   {
      "type": "file",
      "format": "text",
      "path": "/home/ubuntu/logs/gateway.log",
      "template": null
   },
   {
      "type": "stdout",
      "format": "text",
      "template": null
   }
]'
Disable file logging
To disable logging to a file, remove the file config from the accessLogs setting:
dashmate config set platform.gateway.log.accessLogs '[
   {
      "type": "stdout",
      "format": "text",
      "template": null
   }
]'
Change log level
Platform gateway service logs support several levels of detail. In increasing order of detail they
are: critical, error, warn, info (default), debug, and trace. To disable
service logs, set the log level to off.
The log level can be changed by using dashmate config set to update the
platform.gateway.log.level value. For example, run these commands to change the gateway service
log level to debug on your dashmate node:
dashmate config set platform.gateway.log.level debug
dashmate restart --platform
View log settings
To view the current Platform gateway log settings, run:
dashmate config get platform.gateway.log
Drive ABCI logs#
Enable file logging
Use dashmate config set to configure a location for storing Platform ABCI logs on the host
file system. Replace the example path with one that matches your system:
dashmate config set platform.drive.abci.logs '{
   "stdout": {
      "destination":"stdout",
      "level": "info",
      "format":"compact",
      "color":true
   },
   "file": {
      "destination": "/home/ubuntu/logs/drive-abci.log",
      "level": "info",
      "format": "compact",
      "color": true
   }
}'
Disable file logging
To disable logging to a file, remove the file config from the logs setting:
dashmate config set platform.drive.abci.logs '{
   "stdout": {
      "destination":"stdout",
      "level": "info",
      "format":"compact",
      "color":true
   }
}'
Change log level
Drive ABCI logs support several levels of detail. In increasing order of detail they are: error,
warn, info (default), debug, and trace. A logging specification string can also be
provided in the RUST_LOG format for more flexibility. To disable service logs, set the log level to
silent.
The log level can be changed by using dashmate config set to update the
platform.drive.abci.logs.*.level value. For example, run these commands to change the log levels
for file logging and stdout logging to debug on your dashmate node:
dashmate config set platform.drive.abci.logs.file.level debug
dashmate config set platform.drive.abci.logs.stdout.level debug
dashmate restart --platform
View log settings
To view the current Platform gateway log settings, run:
dashmate config get platform.drive.abci.logs
Tenderdash logs#
Enable file logging
Use dashmate config set to configure a location for storing Tenderdash logs on the host file
system. Replace the example path with one that matches your system:
dashmate config set platform.drive.tenderdash.log.path "/home/ubuntu/logs/drive-tenderdash.log"
Disable file logging
To disable logging to a file, set the path back to null:
dashmate config set platform.drive.tenderdash.log.path null
Change log level
Tenderdash logs support several levels of detail. In increasing order of detail they are:
error, warn, info (default), debug, and trace. A logging
specification string can also be provided in the RUST_LOG format for more flexibility. To disable
service logs, set the log level to silent.
The log level can be changed by using dashmate config set to update the
platform.drive.abci.logs.*.level value. For example, run these commands to change the log level
to debug on your dashmate node:
dashmate config set platform.drive.tenderdash.log.level debug
dashmate restart --platform
View log settings
To view the current Tenderdash log settings, run:
dashmate config get platform.drive.tenderdash.log
Collect logs#
Dashmate includes the doctor command to make troubleshooting and log reporting easier. The dashmate doctor command collects important debugging data about the masternode and creates a compressed report file that can be sent to the support team if necessary. This report includes:
Operating System: Details about the architecture, CPU, memory, and swap
Docker: Status and logs (exit codes, stdout, stderr) for each service
Core RPC: Essential details like the best ChainLock, quorums, blockchain information, peers, and masternode status
Tenderdash RPC: Status, genesis, network information, ABCI details, and a consensus state dump
Metrics: Tenderdash and Drive metrics (if enabled in the configuration)
To create a report, run dashmate doctor and select Yes:
dashmate doctor
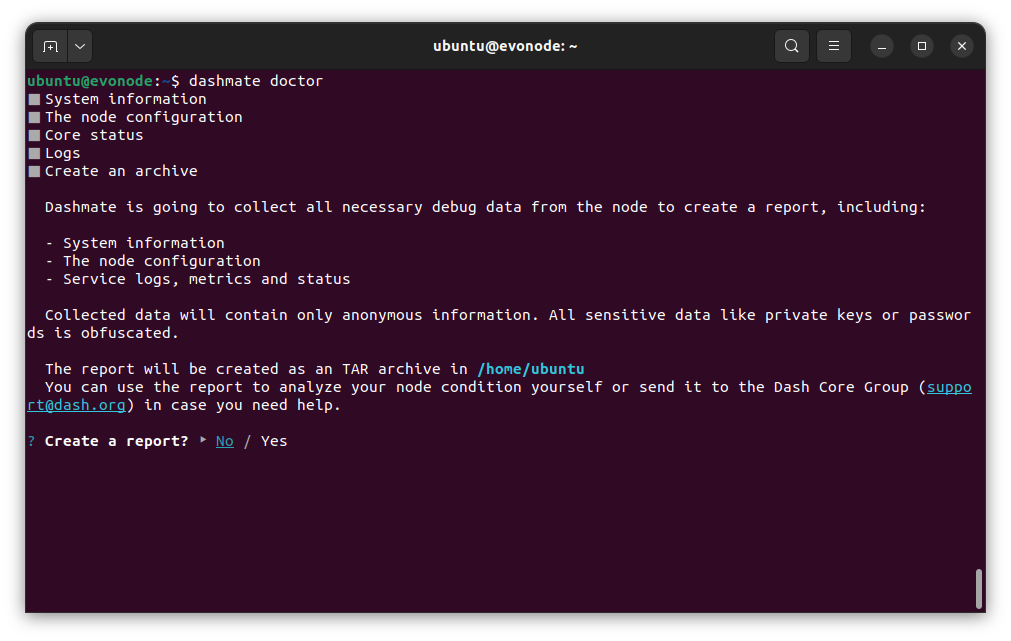
Run the doctor command#
Upon successful completion, the full path to the report archive is displayed.
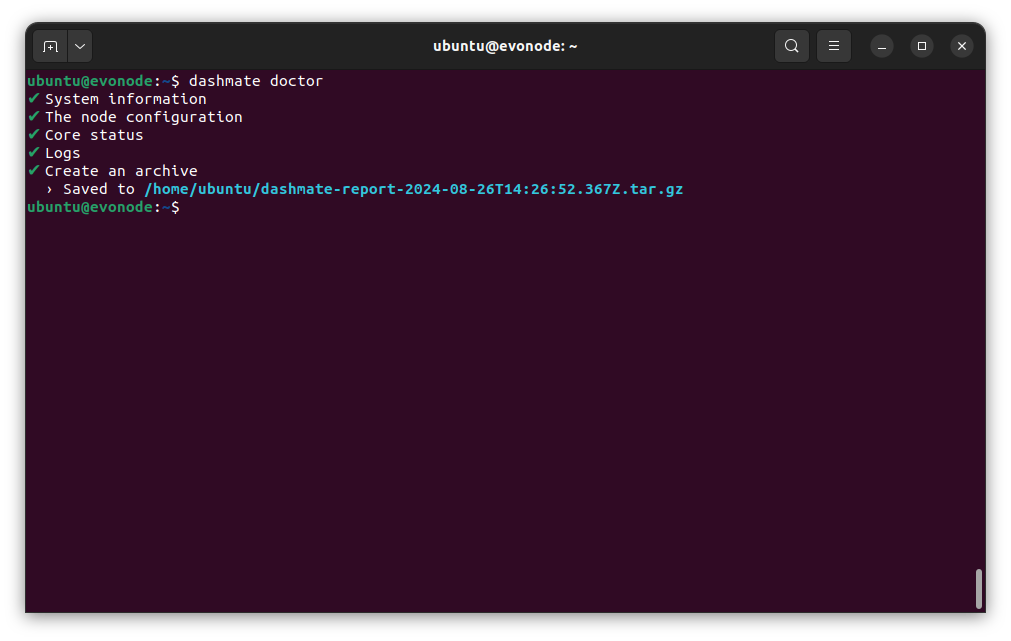
Doctor output#
Metrics#
To provide better network visibility to DCG developers for troubleshooting, volunteers can contribute metrics to the DCG metrics server.
Enable metrics on your dashmate node
dashmate config set platform.gateway.metrics.enabled true
dashmate config set platform.gateway.metrics.host 0.0.0.0
dashmate config set platform.gateway.metrics.port 9090
dashmate config set platform.gateway.admin.enabled true

dashmate config set platform.gateway.rateLimiter.metrics.enabled true
dashmate config set platform.gateway.rateLimiter.metrics.host 0.0.0.0
dashmate config set platform.gateway.rateLimiter.metrics.port 9102

dashmate config set platform.drive.abci.metrics.enabled true
dashmate config set platform.drive.abci.metrics.host 0.0.0.0
dashmate config set platform.drive.abci.metrics.port 29090

dashmate config set platform.dapi.rsDapi.metrics.enabled true
dashmate config set platform.dapi.rsDapi.metrics.host 0.0.0.0
dashmate config set platform.dapi.rsDapi.metrics.port 9091

dashmate config set platform.drive.tenderdash.metrics.enabled true
dashmate config set platform.drive.tenderdash.metrics.host 0.0.0.0
dashmate config set platform.drive.tenderdash.metrics.port 26660

dashmate restart --platform
Grant access to metrics from the DCG metrics server (34.219.3.238) by updating your network configuration (i.e., your firewall, AWS security groups, etc.)
Provide DCG with your IP address and port so it can be added to the DCG Prometheus server
Informazioni aggiuntive#
Per ulteriore documentazione consultare il repository dashmate.